- Price has dropped down to $37.948.
- Polkadot price analysis confirms downtrend.
- Support is standing at $33.31 point.
The latest Polkadot price analysis predicts a downward trend for the day, as the price underwent a considerable decline in the last 24-hours. Although the bulls were at the leading position earlier, the current scenario favors the bears. The price moved down to $37.95 today as a result of the sudden drop. We can expect the price to touch further lows in the next few hours if the bearish momentum strengthens.
DOT/USD 1-day price chart: Price lowers to $37.95 as a result of downturn
The one-day Polkadot price analysis is giving support for the bears as the price decreased up to $37.95 today. Although the past week supported the cryptocurrency as the bullish trend was at its peak, today, the bears made a comeback. DOT/USD has been devalued up to $37.95, and it might undergo further reduction if the bears remain strong. The moving average (MA) value is standing at $37.46 for now.
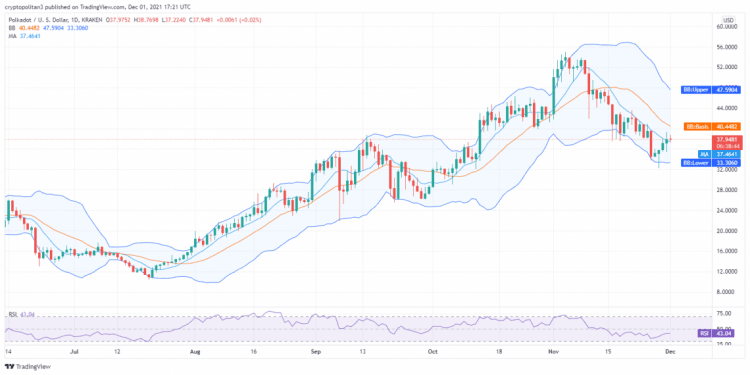
The Bollinger bands average has dropped to $40.45 as the long-term trending line moves in the bearish direction. The upper Bollinger band value is now at $47.6, whereas the lower Bollinger band value is now standing at $33.31. The Relative Strength Index (RSI) score decreased up to 43.04 due to downtrend.
Polkadot price analysis: Cryptocurrency value reduced to $37.93 as bears lead
The four hours Polkadot price analysis confirms a bearish trend as the bears have been dominating the price charts for the past four hours. The price movements have constantly been fluctuating, but now the bears are on the lead once again. The price declined up to $37.93 as the selling momentum got more robust with each hour. The moving average value in the four hours price chart is $37.83, which is still relatively low compared to the current price.
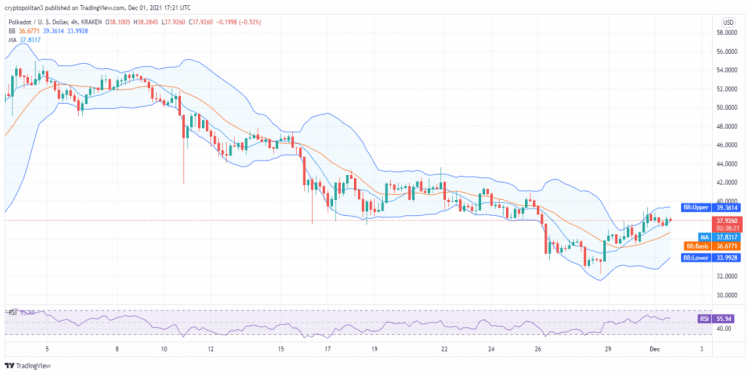
The volatility is decreasing, which is a positive indication regarding future market trends. The Bollinger Bands Indicator dictates the following values; the upper Bollinger band value is $39.36, while the lower Bollinger band value is $33.99. The RSI curve is showing a downward movement as well as the score has dropped to 55.94.
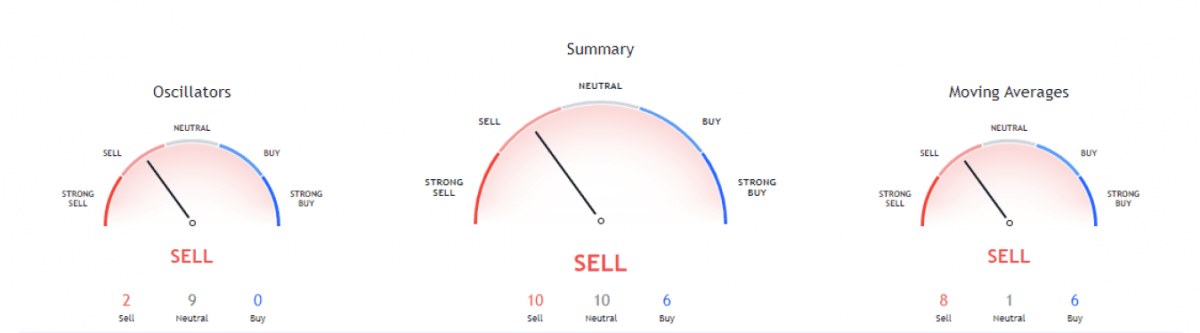
A significant rise in the selling trend has been observed over the past few weeks. This is why the technical indicators chart for DOT/USD is predicting a selling trend. There are ten indicators on the selling and neutral positions, while six hands are on the buying position.
The Moving Averages Indicator predicts a bearish trend as well by giving out a selling signal. A total of eight indicators are on the selling side; six hands are on the buying side, while only one indicator is on the neutral side. The Oscillators are giving a selling hint. Nine oscillators are at the neutral position; two oscillators are at the selling while zero oscillators are at the buying position.
Polkadot price analysis conclusion
The one-day and four-hour Polkadot price analysis confirms a decreasing trend for the day as the price has undergone a significant decline. The DOT/USD value is now settled at $37.95, and further devaluation is expected in the upcoming week. The hourly prediction is going in favor of the bears, as well as the cryptocurrency faced loss in the last four hours.
Disclaimer. The information provided is not trading advice. Cryptopolitan.com holds no liability for any investments made based on the information provided on this page. We strongly recommend independent research and/or consultation with a qualified professional before making any investment decisions.