- Price has improved up to $212 mark.
- Litecoin price analysis shows uptrend.
- Support is quite stable at $177.72.
The latest Litecoin price analysis predicts an upward trend for the day as a significant amount of recovery in LTC/USD value was detected. The bullish momentum is on the rise again as the buying pressure is increasing. Today, a successful climb to $212.11 was achieved because of consecutive bullish wins in the past week. Although the market was being led by the bears earlier, today’s trend has been relatively encouraging.
LTC/USD 1-day price chart: Price towers above $212.11 after upward strike
The one-day Litecoin price analysis shows a bullish trend as the market is going in support of the buyers today. The short-term trending line is also moving ascendingly now as the past week has been highly favorable for the bulls. Today, a significant rise in coin value was detected once again as the price reached $212 height. The moving average (MA) value, on the other side, is still at a relatively lower position, i.e., $207.70.
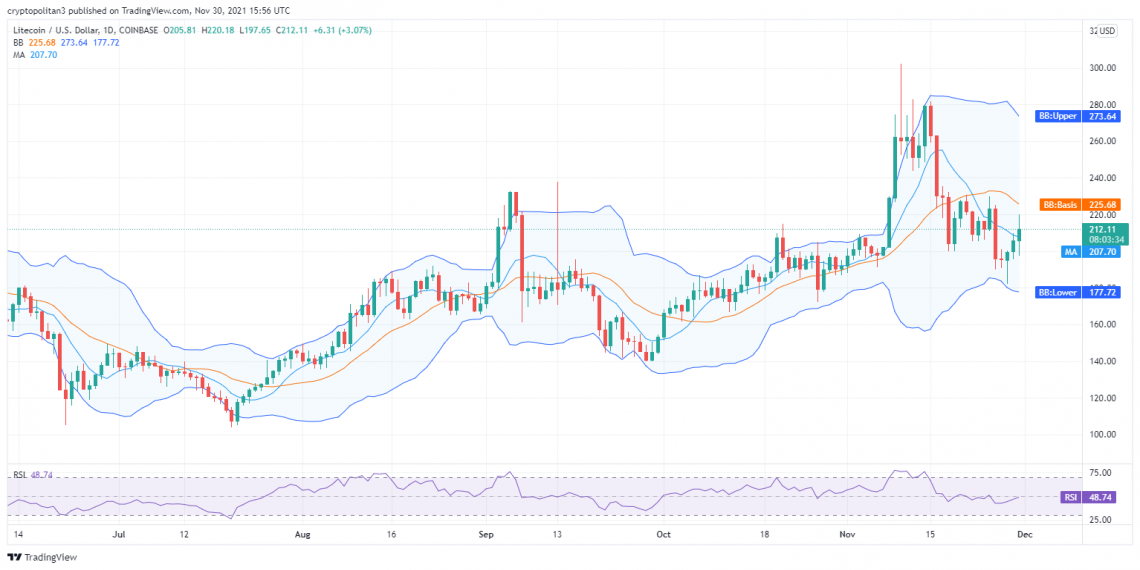
The Bollinger band average has declined up to $225.68 because of the previous downtrend. At the same time, the upper Bollinger band value has shifted to $273.64, while the lower Bollinger band has changed to $177.72. The Relative Strength Index (RSI) graph shows an upward curve with an average score of 48.74.
Litecoin price analysis: LTC value successfully tops $211 resistance after uplift
The bulls have been reigning the market for the past few hours as a consistent uptrend has been observed. The bullish curve marks a definite increasing trend as the price has been uplifted above the $211.25 resistance point. The LTC/USD value is now standing at $212.03 high after a remarkable recovery. If we talk about the moving average value in the one-day price chart, it is settled at the $203.79 position.
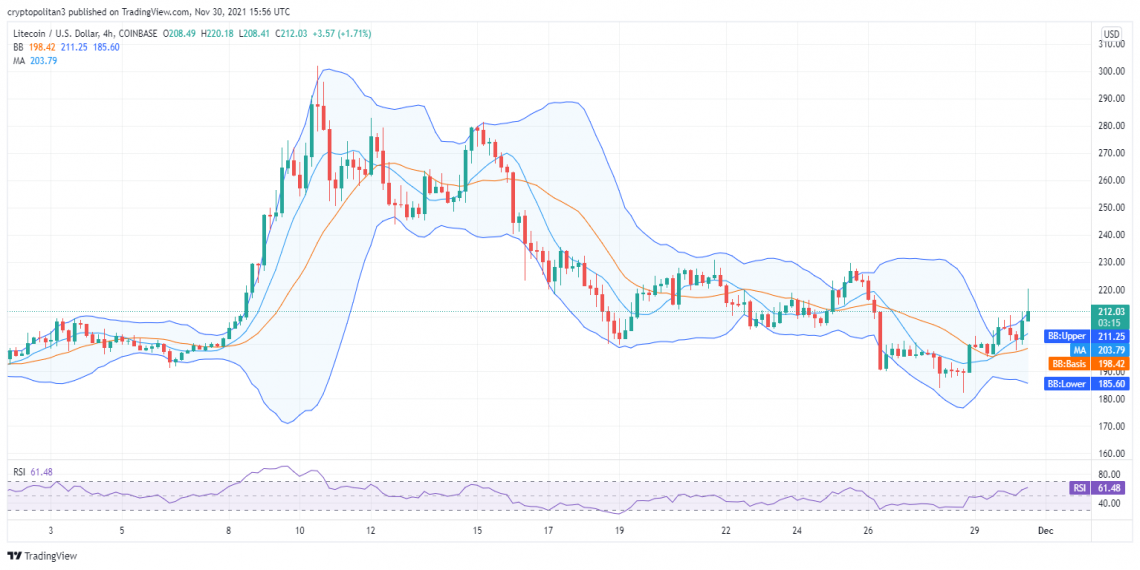
The volatility is tremendously rising, which on the opposite, is a negative indication regarding the future trends. The upper Bollinger band is now at $211.25 end, and the lower Bollinger band is present at $185.60 end present. The RSI curve is showing an upgrade in LTC value as well as the score has reached 61.48.
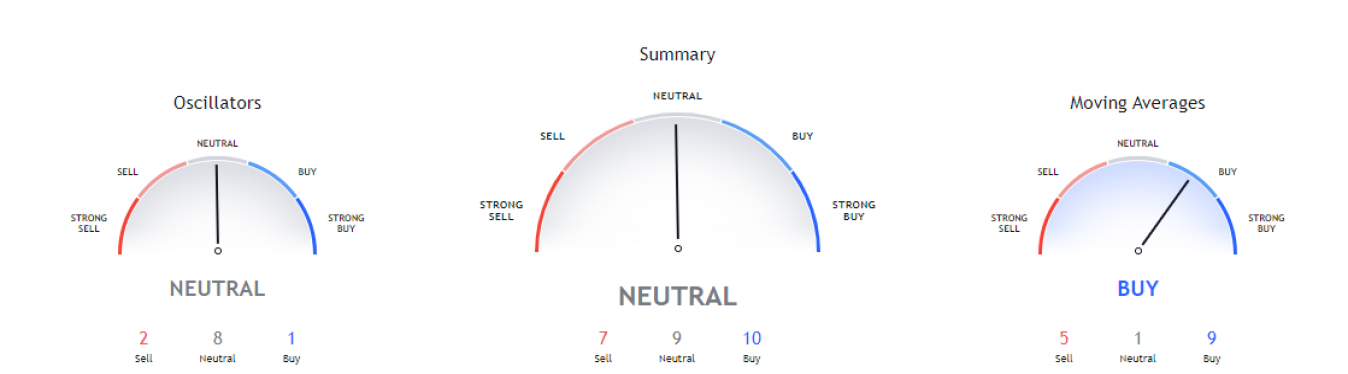
The technical indicators chart for LTC/USD gives a neutral hint regarding the market trends, as a constant variation in price movements has been observed. A total of 10 indicators are on the buying side; nine hands are on the neutral side, while seven are on the selling side.
The Moving Averages Indicator supports the bulls by giving out a buying signal. We can see that five indicators are standing on the selling mark, nine hands are on the buying, and only one indicator is on the neutral mark. The oscillators show a neutral trend once again as eight oscillators are on a neutral position, two oscillators are selling, and one oscillator is on the buying position.
Litecoin price analysis conclusion
The daily and hourly price charts display green candlesticks today as a considerable improvement in LTC/USD value has been detected. The price is now at $212.11, and further recovery can be expected if the buying rate increases. The hourly price prediction is also giving the lead to bulls because of the rapid rise in coin value in the last few hours.
Disclaimer. The information provided is not trading advice. Cryptopolitan.com holds no liability for any investments made based on the information provided on this page. We strongly recommend independent research and/or consultation with a qualified professional before making any investment decisions.