- VET price analysis is bullish as the token rose by 5% in the last 24 hours
- The price fractal tested the important support trend line
- The nearest support is present at $0.1155
The VET price analysis is bullish for today, soaring by more than 5% in the last 24 hours. Moreover, as per data from CoinMarketCap, the trading volume of the token rose by 3.42%, while the market cap also rose by 5.18%, standing at nearly 7.9 billion USD. The market rank of the token is 26.
On the other hand, the prices today opened at $0.1212, reaching a daily high of $0.1253 after a daily low of $0.1155 which was a support zone. However, the candle is yet to close. The 7-day low stands at $0.1046, while the 7-day high stands at $0.1323, indicating a huge bullish potential.
VET price analysis using technical indicators
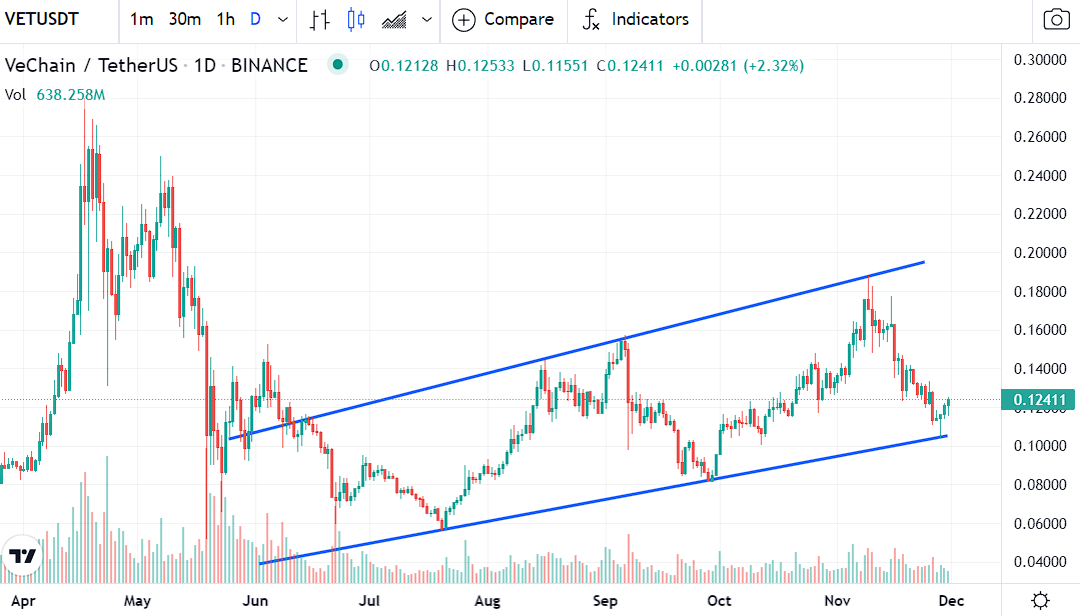
The technical indicators for VeChain price are important when figuring out a breakout or breakdown point in the price action of any trading pair. According to the chart below, the token has successfully tested the trendline of support below and, as per the trend, will aim to create higher highs.
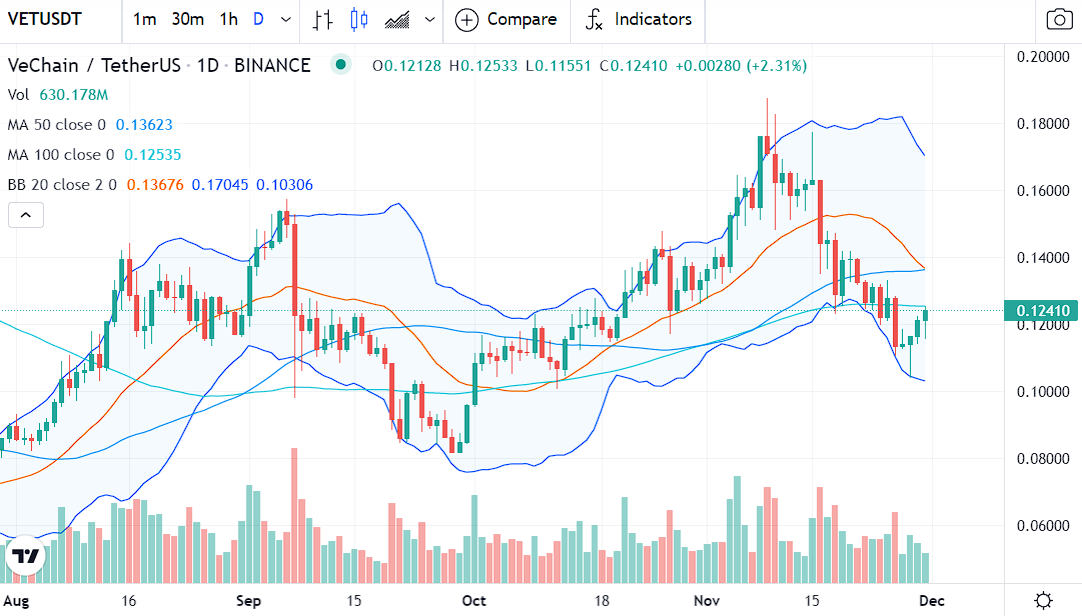
The 50-day Moving Average was above the price movement. However, in the chart below, the bulls are taking over the price action and aim to turn it into support. However, the prices are still sluggish and near the lower end of the Bands after breaking down.
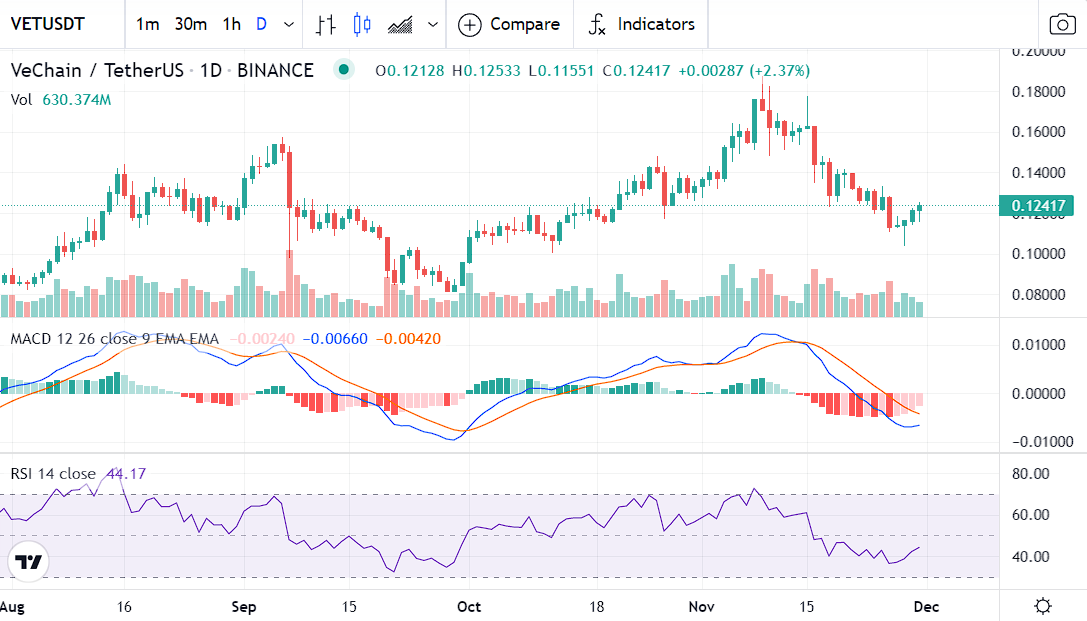
The MACD indicator witnessed a bearish divergence a while ago, turning the price action bearish as the MACD histogram was filled with red bars. However, the two lines are closing in, indicating a surge in bullish sentiment.
The RSI indicator is also bearish, but the gradient is positive, and bulls are taking over the price movement. Higher prices are definitely possible in the short term
Conclusion
VeChain tested an important support trend today and following this event, and we can expect the formation of higher highs. However, we need to have patience for the bulls to be back in full gear.