- Downtrend lowers coin value to $225.6
- Aave price analysis shows downtrend.
- Support is present at $219.27 level.
The latest Aave price analysis shows signs of a downtrend, as the price underwent a substantial decline in the last 24-hours. If we analyze the market situation from a general overview, the past few weeks have proved to be highly supportive for the buyers. A constant downtrend has been on the rise, and a similar trend was observed even today, providing opportunities to the buyers waiting for a lower price, as the market price of AAVE/USD was brought down to a $225.57 low.
AAVE/USD 1-day price chart: Downtrend causes price depression up to $225
The one-day Aave price analysis confirms a bearish trend for cryptocurrency, as the AAVE/USD value is going through a drop. A considerable degree of downfall in coin value is being detected due to rising bearish pressure. If the sellers remain persistent, it can be predicted that the price will lower further in the next few weeks. The price is now standing at $225.57, which is a relatively lower level if we compare it to its moving average (MA) value of $253.78.
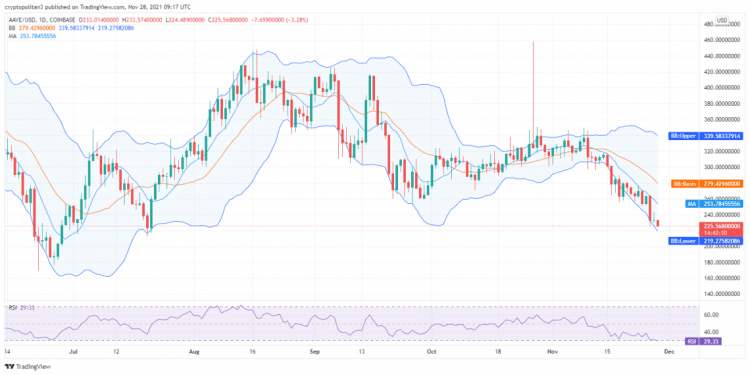
The volatility is expanding because of the continuous extension in the downward trend. The upper end of Bollinger Bands Indicator is now at $339.6 position, whereas its lower back is standing at $219.3 place. The Relative Strength Index (RSI) score has gone below the under-bought limit now as the score is touching 29.33.
Aave price analysis: Bears strike back by bringing price down to $225 again
The four-hour Aave price analysis dictates a downtrend as the bears have been maintaining their lead quite efficiently. Although the bulls managed to upgrade coin value in the earlier hours of the day, the bears have successfully secured their lead once again. The downtrend has resulted in price devaluation up to the $225.49 mark, encouraging the sellers. If we discuss the moving average indicator, then its value is currently $233.64.
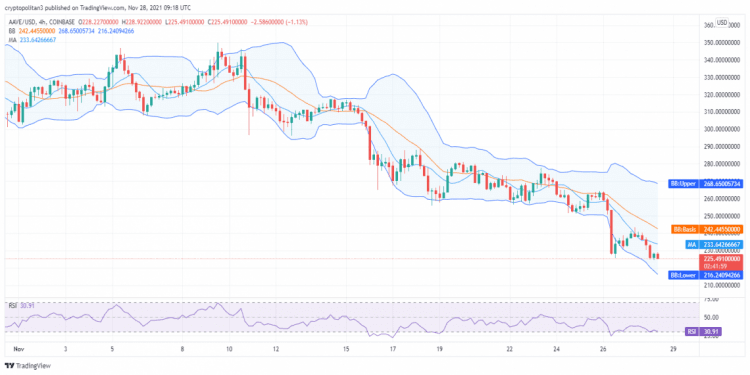
The Bollinger bands average has moved down to $242.44 because of the constant decreasing trend. The upper band of Bollinger Bands Indicator is now touching the $268.65 mark, and the lower band is touching the $216.24 mark. The RSI curve is moving descendingly as the score is now 31.
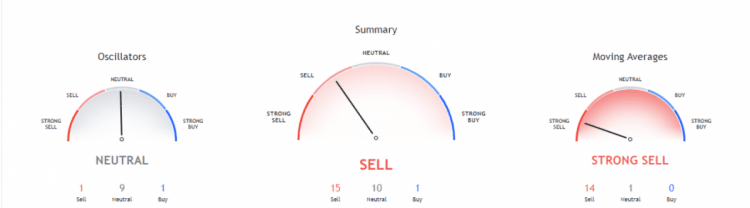
The technical indicators chart for AAVE/USD predicts a downtrend for the market, as the sellers have dominated it for the past few weeks. We can see 15 indicators settling on the selling position, ten occupying the neutral position, and one buying position.
The Moving Averages Indicator is following a definite bearish trend as well. Fourteen indicators are present on the selling side, while one indicator is on the neutral and zero indicators are on the buying side. On the other hand, the Oscillators are giving a neutral hint for today as nine oscillators are at the neutral point, and one indicator each is on the selling and buying points.
Aave price analysis conclusion
The one-day and four hours Aave price analysis are giving support for the sellers, as a consistent drop in AAVE/USD value is being observed. The price lowered to $225.57 in the last 24-hours, as the bears were leading the game even today. The hourly price chart displays red candlesticks as well, which means that the bears have been ruling the market for the last four hours.
Disclaimer. The information provided is not trading advice. Cryptopolitan.com holds no liability for any investments made based on the information provided on this page. We strongly recommend independent research and/or consultation with a qualified professional before making any investment decisions.