- Price has moved down to $190.85.
- Litecoin price analysis favors bears.
- Support is provided at $178.50.
Litecoin-price-analysis-2021-11-28″>The market has been following a bearish trend for the past few weeks as the bears have been achieving milestones quite impressively. This situation has impacted the market value of LTC/USD adversely, as the price dropped down on a critical scale. A downtrend was being observed even today as the price plunged to $190.85 low due to the downside.
LTC/USD 1-day price chart: Price takes a downturn to $190.85 after recent setback
The one-day Litecoin price analysis confirms that the ongoing downtrend is also expected to last for the next few days. The past few weeks have brought quite unfavorable circumstances for the cryptocurrency buyers, as the price underwent a sharp decline. A similar trend was observed today as well, as the price leveled down to $190.85 low due to the bearish current. The moving average (MA) value, on the other hand, is at a relatively stable position of $210.14.
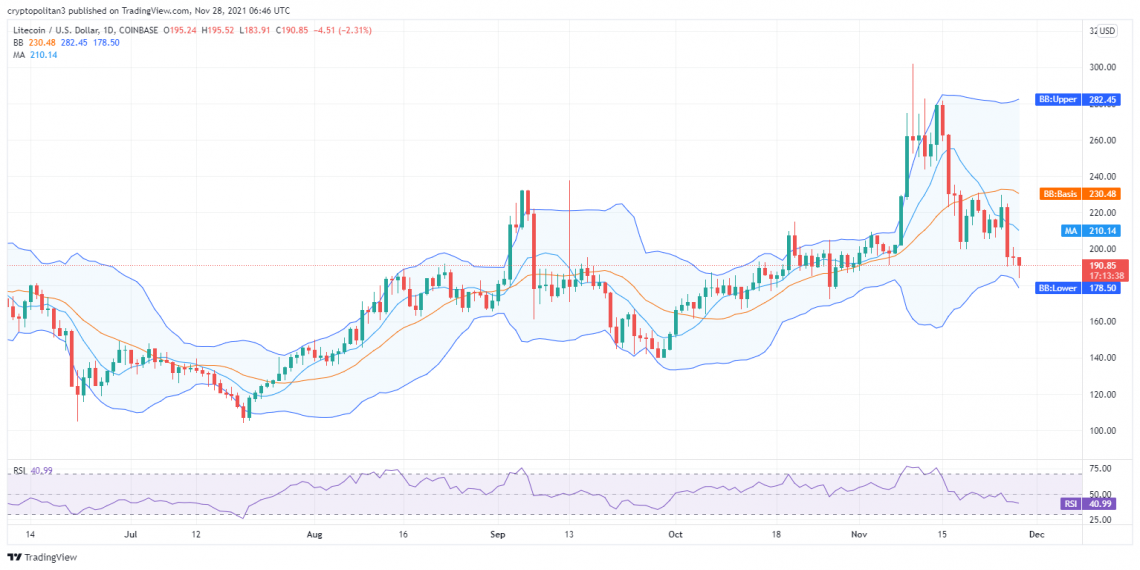
The volatility is high as the downtrend is continuously expanding. After repositioning, the upper Bollinger band value is now $282.45, and the lower Bollinger band value has decreased to $178.50. The Relative Strength Index (RSI) graph shows a downward curve as the score has decreased up to 40.99.
Litecoin price analysis: Bulls move ahead taking price above $190 edge
The four-hour price chart for Litecoin price analysis signals green as a bullish movement has been observed in the last four hours. The bulls are struggling for recovery as the price underwent a significant decline in the earlier hours. On the other hand, the previous four hours were slightly favorable for the bulls as the price stepped above $190.67 after receiving an upward push. The price is still relatively lower than its moving average value, i.e., $195.01.
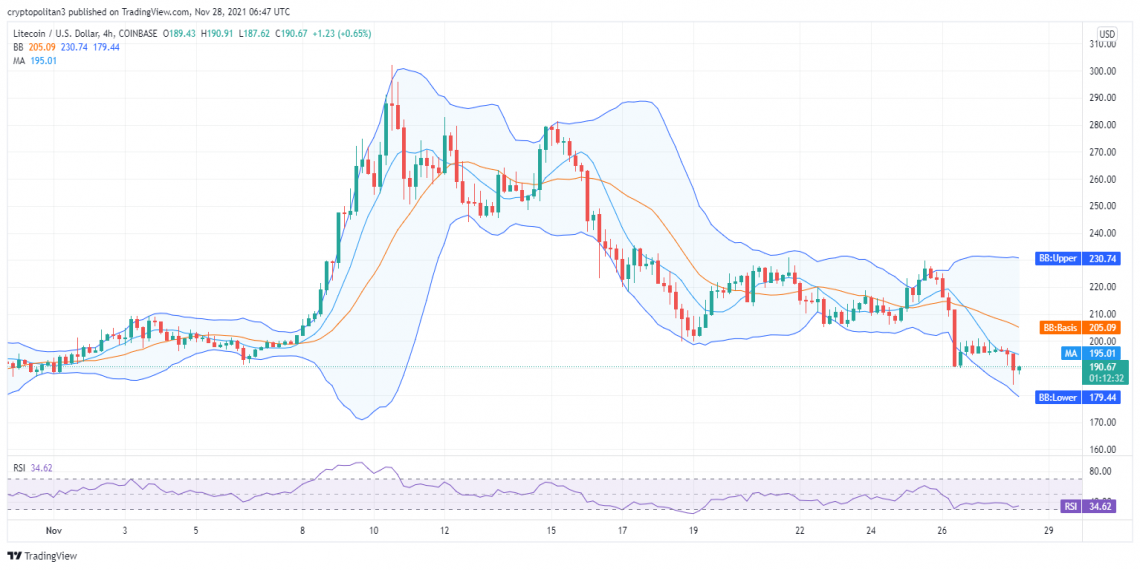
The volatility is on the rise, which means that the downtrend is to continue in the future. The upper Bollinger band balances at $230.74, whereas the lower Bollinger band is present at $179.44. The RSI score is critically low, i.e., 34.62, and is expected to soon go below the under-bought limit.
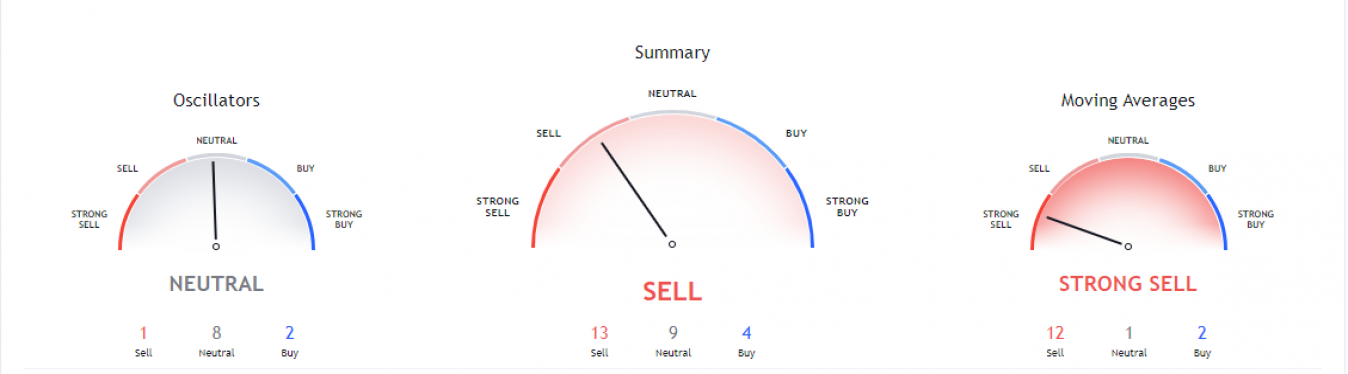
The price has been covering a downward range for the past few weeks as the bears have been securing wins quite consecutively. The technical indicators chart gives this a bearish indication. 13 indicators are on the selling side; nine hands are on the neutral, and four are on the buying side.
The Moving Averages Indicator favors the bears by giving out a substantial selling signal. We can see that 12 indicators are found at the selling point; two hands are at the buying point while only one indicator is at the neutral point. The oscillators predict a neutral trend for the day, as nine oscillators are on the neutral end, two oscillators are on the buying, and one oscillator is on the selling end.
Litecoin price analysis conclusion
The daily and hourly price predictions favor bears today, as the price has experienced a significant downfall in the last 24-hours. The long-term trending line is also moving in the descending direction now as the bears have been leading the price charts for a while now. The price is continuously reducing, and today, the cryptocurrency value was lowered to $190.85 point because of the downtrend.
Disclaimer. The information provided is not trading advice. Cryptopolitan.com holds no liability for any investments made based on the information provided on this page. We strongly recommend independent research and/or consultation with a qualified professional before making any investment decisions.