- Terra price analysis is bullish today.
- The price is now touching $45.96.
- The next resistance is at $48.1.
The Terra price analysis is bullish as an increase in price has been observed today. LUNA/USD has been on an uptrend from 23rd November again, after being on a downtrend from 9th November to 22nd November when the price dropped serial-wise from $54, going below the psychological mark of $50 towards the $40 range. However, the trend seems to be making a shift now as bullish momentum is gaining strength.
Overall the broader cryptocurrency market is bearish today as well, as after the market crash of 26th November, yesterday a slight improvement was observed, but the market has been unable to gain momentum back, and today the giants’ Bitcoin and Ethereum are again reporting losses up to 1.3 and 2.7 percent respectively, along with many altcoins still struggling in a bearish cycle. However, Terra managed to regain all its lost value yesterday and continues upside today as well, being one of the best performers.
LUNA/USD 1-day price chart: Bullish momentum drives price above $45
The 1-day price chart for Terra price analysis shows that the coin traded in a range of $43 to $46 while swinging wildly towards extremes of $42.2 on the lower side and $47 towards the upside. Currently, the LUNA/USD pair is trading hands at $49.96 at the time of writing. LUNA also reports an increase in value by 9.6 percent over the last 24 hours and an increase in value by 5.41 percent over the past week, increasing the market cap by 11 percent. However, the trading volume is down by 10.59 percent for today.
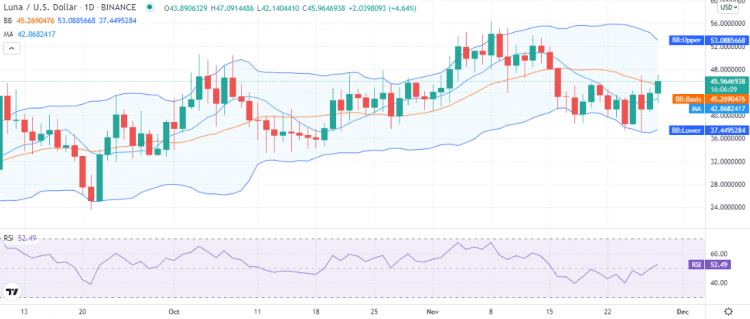
The price volatility is high for LUNA, but now the volatility indicator shows signs of a decrease in volatility as the extreme ends of the Bollinger bands have started to converge. The price traveled above the mean average of the indicator today, and the mean average at $45.2 now represents support for LUNA. While the upper band at $53 represents the resistance level for LUNA.
The moving average (MA) is trading below the price level at the $42.8 mark, complementing the bullish momentum, and the relative strength index (RSI) is also on an upwards slope at index 52, indicating the buying activity in the market.
Terra price analysis: Recent developments and further technical indications
The 4-hour price chart for Terra price analysis reveals the price breakout was downwards at the start of today’s session, and the price was devalued till $42.8, but LUNA rejected further downside, and bulls took over the price function, taking the price above yesterday’s level of $43.9 in a swift move.
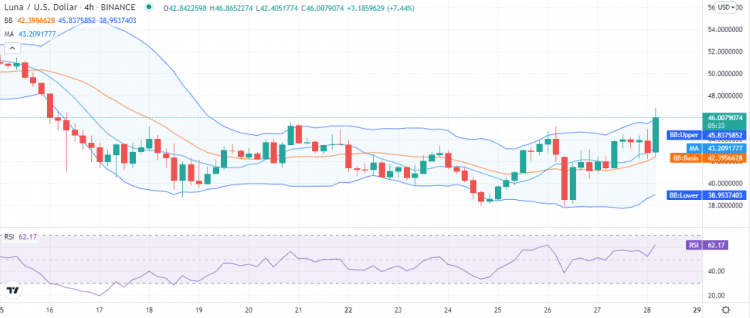
The volatility indicator has taken an upwards breakout on the 4-hour chart and also shows slightly high volatility for LUNA, with the price trading above the upper Bollinger band and the upper band at $45.8, representing a new support level for LUNA. The RSI is also on a steep upwards curve at index 62 in the upper half of the neutral zone. The RSI indicates the intense buying activity in the market.
Terra price analysis conclusion
The terra price analysis suggests that the cryptocurrency is showing a high bullish tendency as the price has improved comparatively better than most other coins. However, LUNA is nearing the overbought condition on the 4-hour chart, but there exists room for more upside. If the buying momentum sustains today and the RSI reaches near index 70, then LUNA may break near $48.
Disclaimer. The information provided is not trading advice. Cryptopolitan.com holds no liability for any investments made based on the information provided on this page. We strongly recommend independent research and/or consultation with a qualified professional before making any investment decisions.