- ANKR price analysis is highly bullish today.
- ANKR is rallying high today as the bull run continues.
- ANKR/USD is trading above $1.8.
ANKR price analysis reveals that the coin seems to be repeating its April bull run as it aims for the record high today. The coin is highly bullish, but we expect ANKR to face strong resistance around the $0.18 to $0.19 range, as some troublesome signs are also appearing at the moment, which we will discuss below with technical assistance. ANKR showed a remarkable performance yesterday, as the increment in price was very steep, and the coin jumped from $0.124 to $0.173, gaining a significant amount of value.
Overall, ANKR has been on an upwards trend since the start of October. Still, we see a consolidation phase between 2nd and 25th November, as the coin averaged between $0.10 to $0.12 price range for this time. Still, as the coin broke out of the $0.136 resistance zone, it was expected to rally towards the $0.16 range, where many different resistance levels were expected. Still, the coin managed to breakout to $0.173 and is continuing upside for today.
ANKR/USD 1-day price chart: Can ANKR blast above $0.2? seems difficult today
The 1-day price chart for ANKR price analysis shows the coin is covering a range upwards after rallying high yesterday. ANKR is trading at $0.185 at the time of writing and has swung as high as $0.219, but as said above, there exists a lot of resistance above $0.175, and the sign has started to appear. However, the coin has gained more than 27 percent value over the last 24 hours and more than 44 percent value over the last week. The trading volume has also increased by a whopping sum of 537 percent during the last 24 hours.
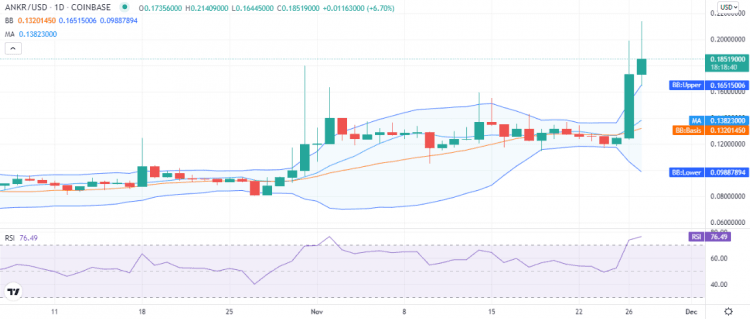
ANKR price analysis further suggests the coin has also started to show high volatility as the Bollinger bands indicator is expanding from 24th November. Its upper band has reached the $0.165 level representing support for ANKR. As the price is trading above the upper band, the lower band has stooped down to $0.098. The indicator is expanding equally on both sides, representing all types of extremes to be expected.
ANKR has already been overbought at the $0.15 price range, as the relative strength index (RSI) indicates. The RSI curve on the 1-day chart has taken a turn and now shows a mild upwards curve after going up steeply, which indicates the coin, after rallying high, may now revert back as the selling pressure has started to build up.
ANKR price analysis: Recent developments and further technical indications
The 4-hour ANKR price analysis shows selling pressure has started as the last candlestick is red as the coin, after spiking up to $0.191, is now spiraling down, washing out the chances for an ATH run for today. ANKR made some high jumps for the last 12 hours, and bullish exhaustion is very clear now, as the selling pressure at this price point is huge.
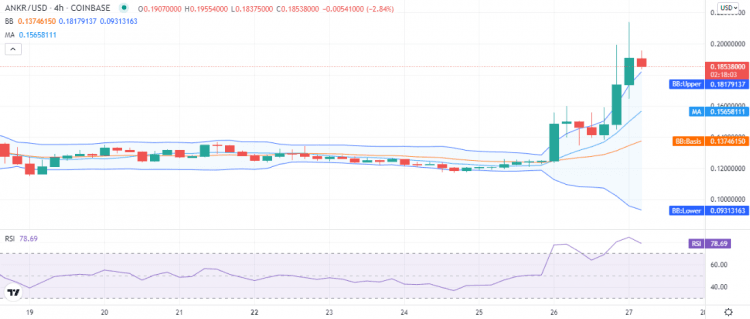
The volatility on the 4-hour chart is also high, with the upper limit of the Bollinger bands representing support for the coin at $0.181, but we expect this support might not hold and crumble soon. The RSI is also supporting this idea as now it shows a downwards slope coming down towards the neutral zone and indicating the selling activity that started in the market.
ANKR price analysis: Conclusion
The ANKER price analysis shows the price started to move up since October, and it was expected that the coin has the potential to retest the $0.15 resistance level and it was also expected if ANKR breaks out of this resistance zone, then it will be on its path to discover ATH, but as the 4-hour chart shows the price has started to spiral down before breaking out to an ATH. As the RSI is also indicating, we think the bullish momentum might give up, and ATH could not be met today; however, ANKR may float above $1.7 for today before rallying further. We suggest cautious trading at this point.
Disclaimer. The information provided is not trading advice. Cryptopolitan.com holds no liability for any investments made based on the information provided on this page. We strongly recommend independent research and/or consultation with a qualified professional before making any investment decisions.