- Price has decreased up to $35.89 level.
- Polkadot price analysis predicts downtrend.
- Support is found at $34.47 position.
Polkadot-price-analysis-2021-11-26″>The market has been following a bearish trend for the past few weeks as the bears have been securing wins consecutively. The price underwent a significant decline in the last 24-hours as well because of the sudden rise in bearish momentum. The latest downtrend has decreased the coin value to $35.9, which has left a pretty negative impact on the market value of DOT/USD.
DOT/USD 1-day price chart: Price levels collapse to $35.9 as bears show consistency
A constant downward trend has been going on for the past couple of weeks, as the selling activity almost reached its peak point. The bears have been dominating the price chart for the past 24-hours as well, as the price went down up to $35.893 moment. The situation is turning more unfavorable for the cryptocurrency buyers, as DOT value is constantly decreasing. Moving on, the moving average indicator is dictating its value at $43.84 at present.
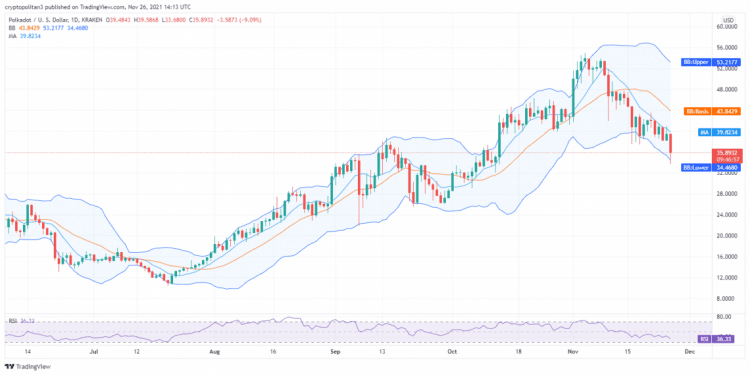
Although the bulls are trying to find their way to recovery, the bears have been making their attempts unsuccessful. The volatility is unchanging, and the upper value for the Bollinger Bands Indicator is now at $53.22, and the lower value is at $34.47. The Relative Strength Index (RSI) score has declined up to 36.33.
Polkadot price analysis: Bulls succeed in rescuing price above $35.8
The four hours Polkadot price analysis predicts an uptrend as the price has undergone a sufficient improvement in the past few hours. The latest price movement is bullish, and the bulls have managed to escape the intensifying downtrend. The price is now at a much stable position, i.e., $35.88, and is expected to reach a further high point in the next few hours. The moving average value has moved down to $38.26, as the bears were leading earlier.
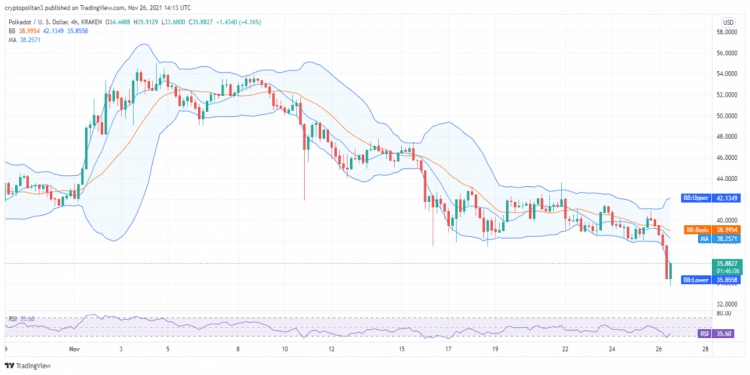
The increase in volatility suggests that the trends might shift soon because of bearish return. Nonetheless, the upper Bollinger bands value has reached $42.13, and the lower Bollinger bands value has moved down to $35.85. The RSI curve confirms the uptrend, and the score has been enhanced up to 35.60.
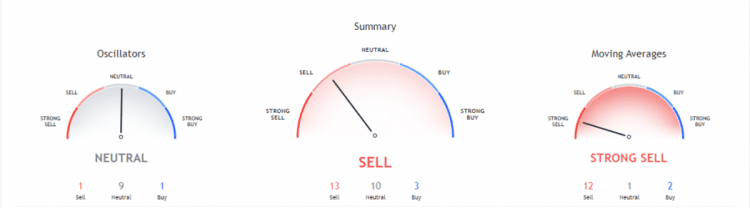
As the bearish momentum is getting stronger, a prominent rise in the selling activity has been going on for the past few months. The technical indicators chart is thus giving out a bearish signal. We can see that 13 indicators are at the selling level, ten hands are at the neutral level, and three are at the buying level.
The Moving Averages Indicator is giving out a solid bearish indication as well. A total of 12 indicators are on the selling side; two hands are on the buying side, while only one indicator is on the neutral side. The oscillators give a neutral hint as nine oscillators are on neutral point, whereas on the one hand, each is on the selling and buying points.
Polkadot price analysis conclusion
The daily and hourly Polkadot price analysis gives a bearish hint as the price has undergone a massive decline today. The price is now settling at the $35.89 level and is expected to lower further in the next couple of days. On the other hand, the hourly price prediction supports the buyers as the price covered bullish movement in the last four hours.
Disclaimer. The information provided is not trading advice. Cryptopolitan.com holds no liability for any investments made based on the information provided on this page. We strongly recommend independent research and/or consultation with a qualified professional before making any investment decisions.