- The Polygon price analysis is bullish today.
- The next resistance for MATIC is found at $1.89.
- Support for MATIC is present at $1.66.
Circumstances are turning positive for MATIC as it breaks above the crucial resistance of $1.75 in a swift move today. The Polygon price analysis suggests the coin corrected yesterday down to $1.68 after rallying high on 23rd November from $1.55 to $1.75, but faced rejection at the later value. However, today MATIC gained enough strength and retested this crucial resistance, successfully turning it into a support level now.
MATIC was on the downslope from 29th October when it was declined from the further upside at 2.13, and MATIC remained on decline till 18th November, but now we can see the short-term trend line for MATIC is turning upwards with the latest bullish momentum.
MATIC/USD 1-day price chart: Bulls regain the lead
On day to day basis, Polygon price analysis shows a good increase in price value today. MATIC is trading exactly at $1.76 at the time of writing, gaining 5.2 percent value over the last 24 hours. MATIC also reports an increase of 6.8 percent in value over the past week. Overall during the week, MATIC made some high spikes, and some steep devaluation was also observed. However, MATIC managed to keep the trend line upwards. The trading volume has also increased by 17.8 percent over the last day, resulting in a market dominance of 0.47 percent. The market cap of MATIC has also improved by a little more than four percent.
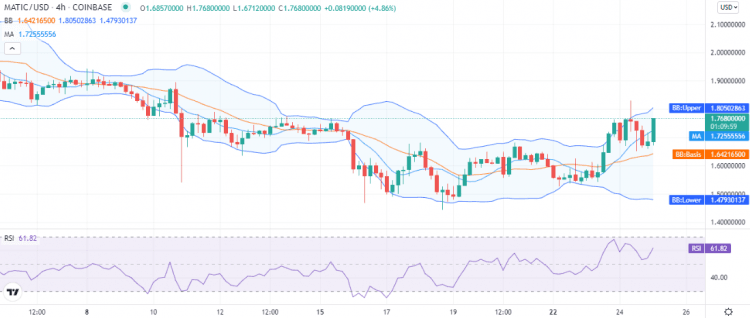
MATIC shows high volatility on the 4-hour chart as well, as the Bollinger bands show divergence, the upper band has reached $1.80 representing resistance for the coin, and the lower band has reached $1.47, the average of the Bollinger bands is present at $1.62 representing support for MATIC. The upper band shows comparatively more divergence towards the upside, hinting at the price regime of MATIC to be towards $2 direction in the coming days.
The RSI on the 4-hour chart is nearing the overbought zone as it has reached index 61 in the upper half of the neutral zone. As the MATIC keeps rallying high, the RSI may soon step into the overbought region for the first time in November. The moving average is trading above the mean average line of the volatility indicator at $172.
Polygon price analysis: conclusion
According to the Polygon price analysis, the market sentiment has turned positive for MATIC, and a good increase in price has been observed today. We expect MATIC to remain bullish for the day if the bullish momentum sustains, as there seems no crucial resistance till the $1.89 level. However, the price range at which MATIC is currently trading is under the bearish zone, and the price oscillation may slow down due to the presence of the bearish elements. If MATIC breaks past $1.89 as well, then the next target will be $2.04. On the other hand, if circumstances turn and MATIC oscillates down, then support may appear near $1.70, but chances are less for the latter to happen.