The Solana (SOL) price increased sharply after a temporary decrease on Thursday, reaching a new yearly high of $51 on Friday.
The SOL price now trades inside the long-term $50 horizontal area. But can it break out above it?
Solana Reaches Long-Term Resistance
The SOL price has increased rapidly since breaking out from a long-term descending resistance trend line and validating it as support in September (green icon).
The rally has been sharp, and the SOL price has not experienced any retracement. During the upward movement, the SOL price moved above the $27 resistance area and is now increasing above the $50 resistance area. While SOL moved above it, it has yet to reach its weekly close above this area.
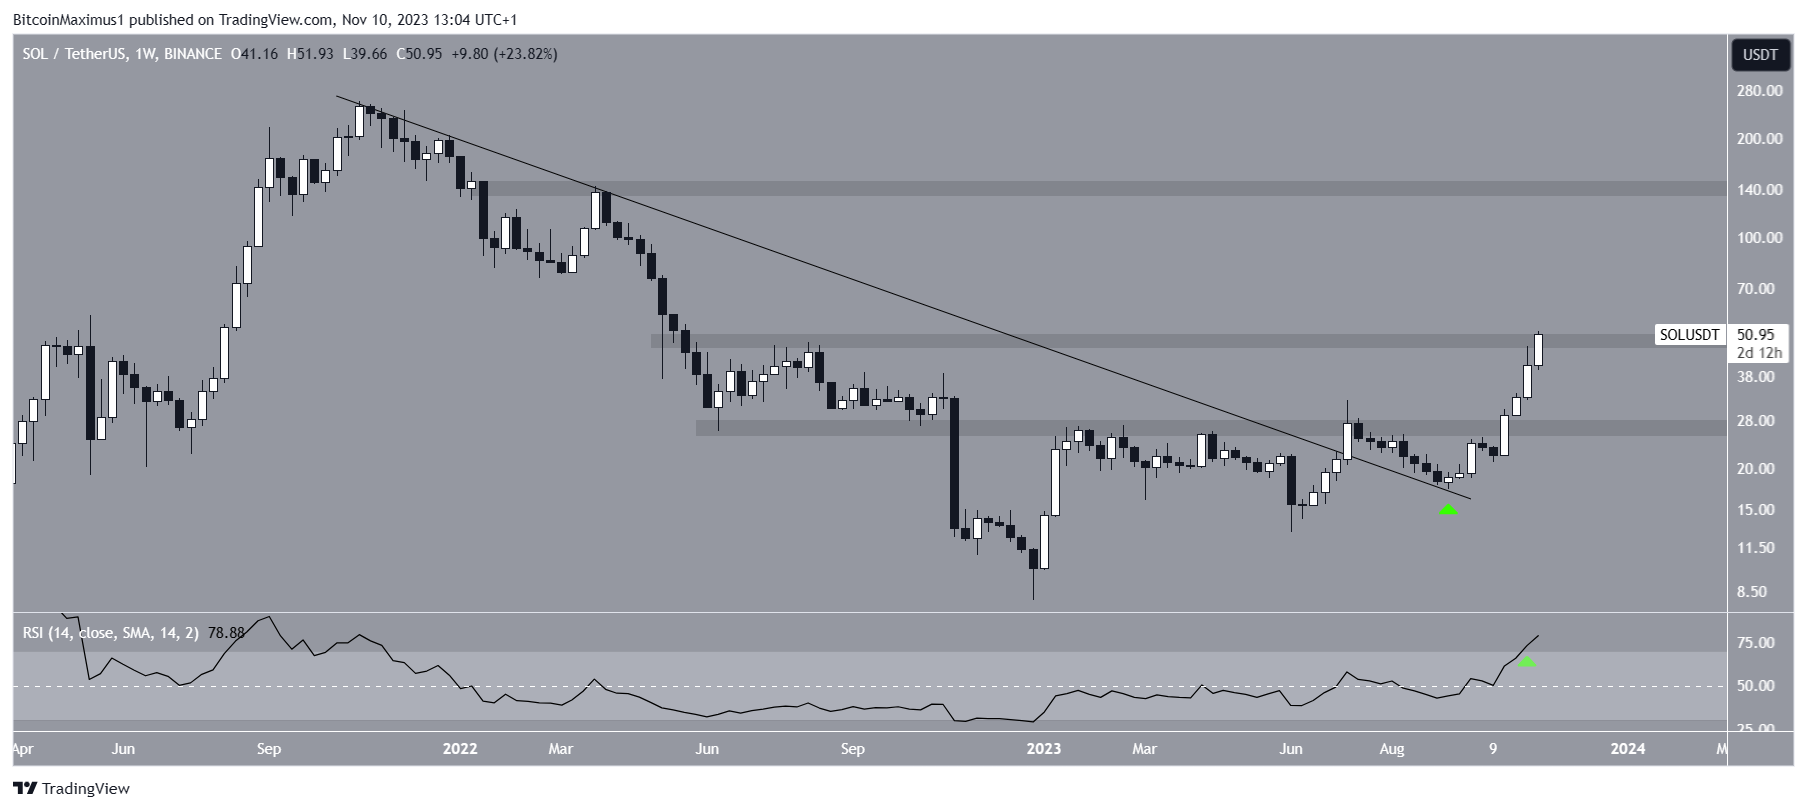
Market traders use the Relative Strength Index (RSI) as a momentum indicator to identify overbought or oversold conditions and to decide whether to accumulate or sell an asset.
Readings above 50 and an upward trend indicate that bulls still have an advantage, whereas readings below 50 suggest the opposite.
The indicator is above 50 and increasing, both signs of a bullish trend. Even though the RSI is overbought (green icon), it has not generated any bearish divergence yet, a warning of an impending price decrease.
For BeInCrypto’s latest crypto market analysis, click here.