The increased selling pressure drives the OKB price lower to the base of the descending triangle. Hence, a bearish fallout is possible below the triangle.
OKB is the cryptocurrency released by the OK Blockchain Foundation and crypto exchange OKEx. It is the third-largest exchange in the world, ranks fourth in trading volume and liquidity, and offers a large selection of trading pairs.
Let us now move ahead to the technical analysis of the OKB token.
Past Performance of OKB
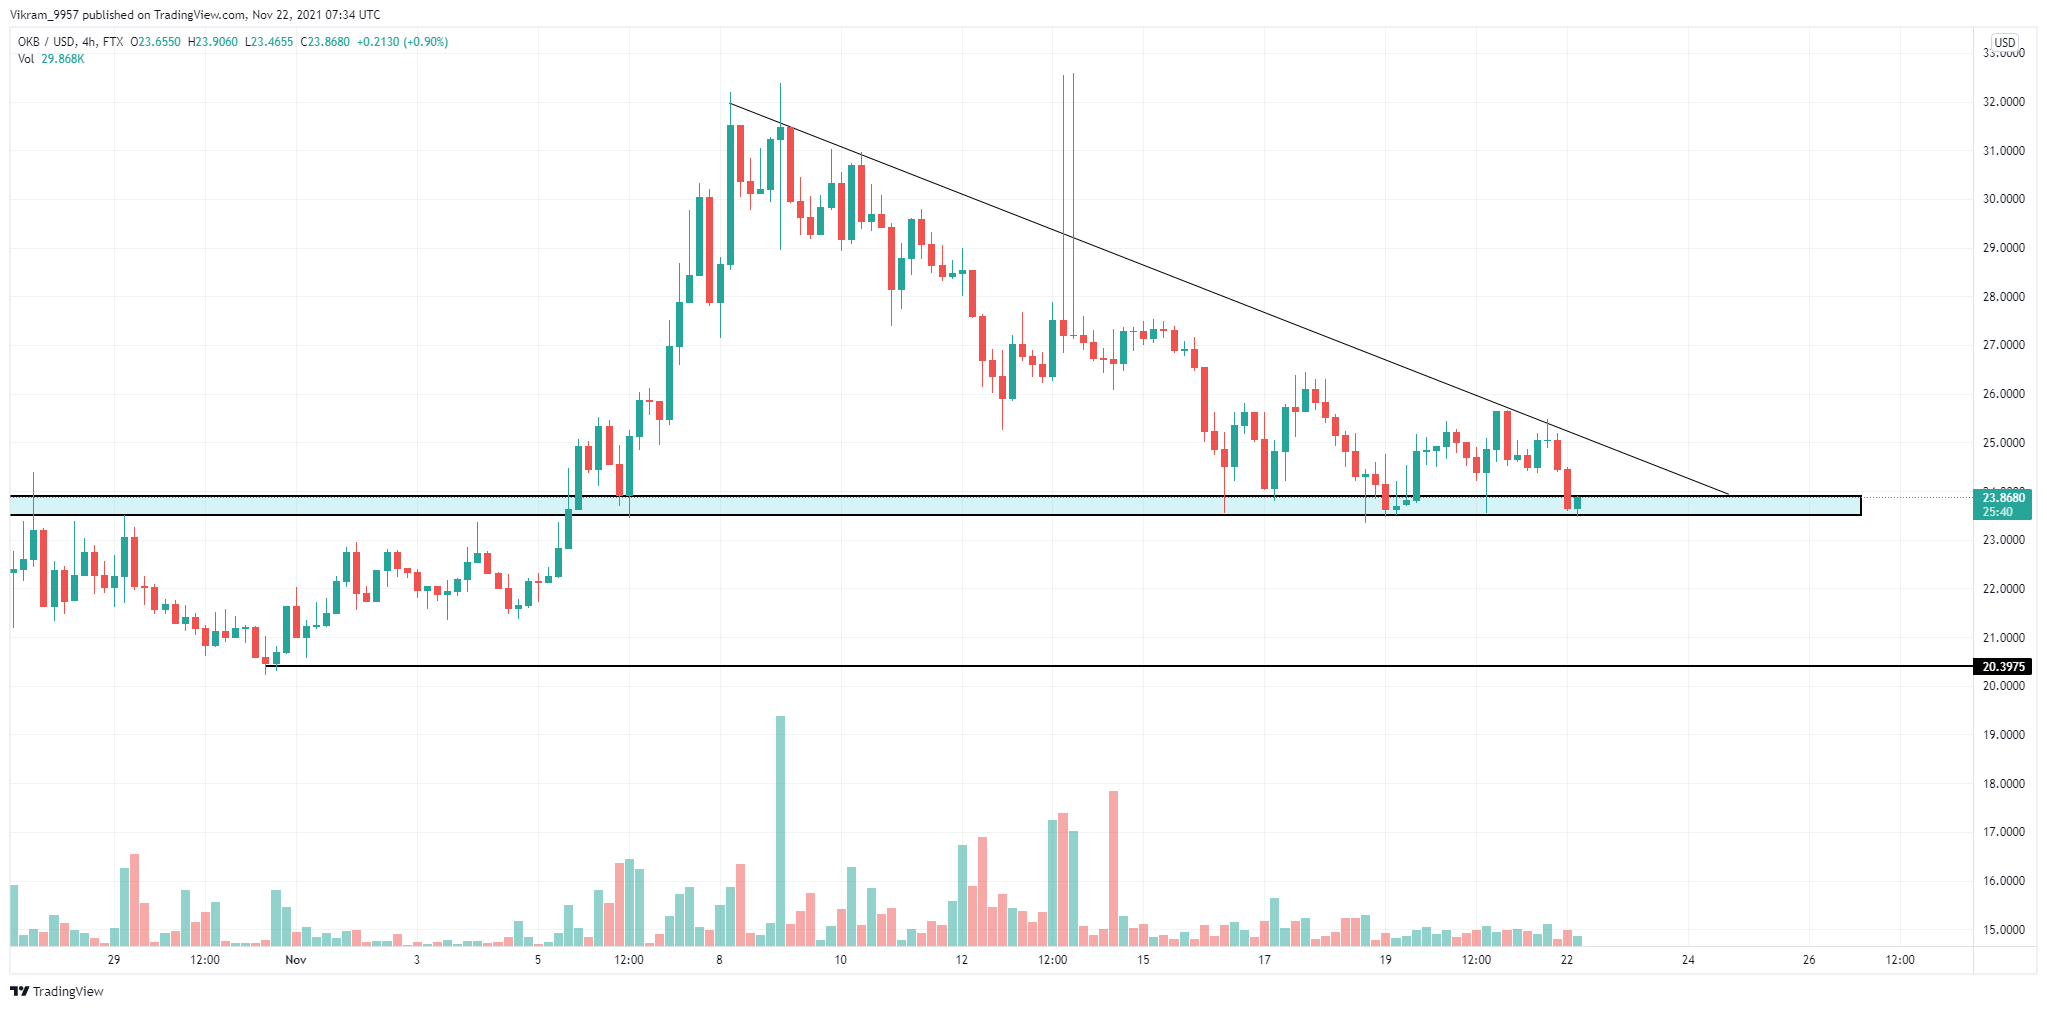
The OKB coin price falls 25% in the past two weeks, retracing to the support zone near the $23.5 mark. Thus, the price action forms a descending triangle pattern in the 4-hour chart.
Hence, the fallout of the $23.5 support zone can serve as an excellent entry spot for bearish traders. Whereas, a bullish reversal might struggle to rise above the resistance trend line in the 4-hour chart.
OKB/USD Daily Chart
OKB Technical Analysis
The descending triangle pattern stands strong in the OKB price chart. However, the price bottles up within the triangle indicating a breakout shortly.
The price action indicates the downfall may find support near the $20 mark. However, if the price manages to rise above the resistance trend line, an uptrend to the $30 mark is possible.
The RSI slope falls below the central line in the 4-hour chart, indicating a solid bearish trend. However, the falling prices fail to push the RSI slope below the 30% mark. Hence, the RSI indicator projects the possibility of a bullish breakout.
The coin price is below all the crucial Exponential Moving Averages in the 4-hour chart. Additionally, the 50-and 100-day EMAs give a bearish crossover in the 4-hour timeframe. Hence, the EMAs provide a sell signal.
Upcoming Trend
The bearish move in the OKB coin price may soon break below the $23.5 support zone as the selling pressure grows. Hence, traders can find a selling opportunity with a target of the $20 mark.
And, in case of a bullish reversal, the solid resistance trend line may push the price back to the support zone.