- The bulls have taken price above $272.
- Monero price analysis shows bullish activity.
- XMR is provided support at $252.10.
The latest Monero price analysis confirms an upward trend for the day as a considerable increase in coin value has been reported. The bullish wave has taken the price above the $272 boundary in the last 24 hours, and a further improvement in price can be expected if the bullish efforts remain consistent. On the other hand, a price drop was recorded during the last four hours, which means that the approaching hours might prove dangerous.
XMR/USD 1-day price chart: Price returns back to $272.41 level as uptrend resumes
The one-day Monero price analysis displays promising results for the cryptocurrency today as a sufficient amount of rising in coin value has been observed. This has created an interesting situation for the buyers, as the bulls have been trending over the market for the past few days. The price has reached its former position i.e. $272.41 and has been rescued above the moving average (MA) value as well i.e. $269.50.
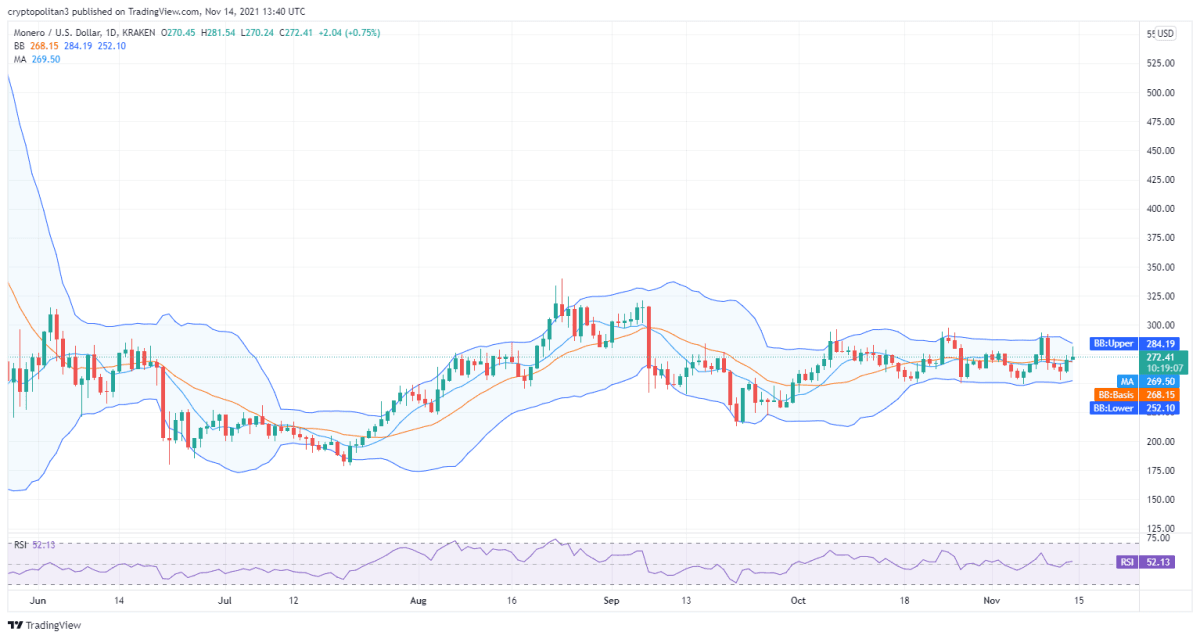
A crossover between SMA 20 curve and the SMA 50 curves took place today, yet another bullish indication. The upper and lower Bollinger band values have changed as well as now the upper value is $284.19, whereas the lower value is $252.10. The Relative Strength Index (RSI) score is still in the average zone and is currently at 52.13.
Monero price analysis: Cryptocurrency receives massive shock at $277 milestone
The XMR price curve has taken a downturn in the last four hours due to the sudden bearish takeover. The price was just about to cross the $277.97 resistance, but the bears made the bullish attempt a failed endeavor. The bearish trend has resulted in the price dropping down to $272.40 value, and a further downfall in XMR value can be anticipated. The price is still above the moving average value, which is found at the $270.35 level.
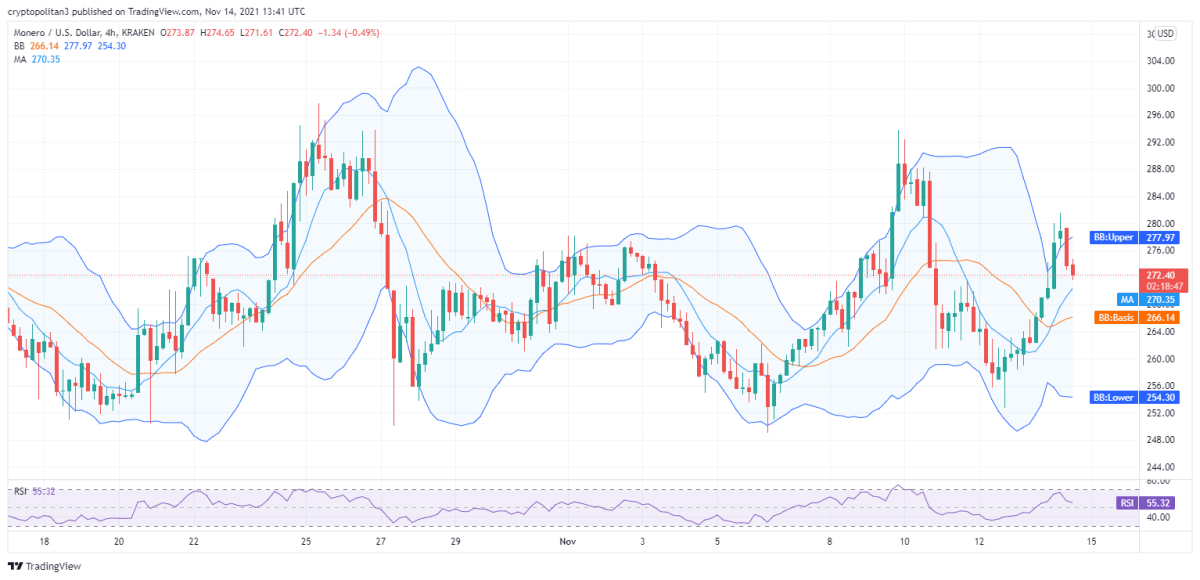
The volatility is increasing, which means that the downtrend might last for the next few hours as well. The Bollinger bands indicator displays the following values; the upper Bollinger band value is $277.97, whereas the lower Bollinger band value is $254.30. The RSI score has dropped down to 55.32 because of the bearish trend.
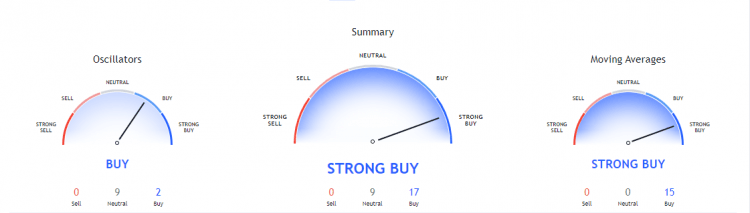
The technical indicators chart for XMR/USD supports the bulls, as the past few months have proved quite profitable for its overall market value. 17 indicators are currently on the buying position, nine indicators are on the neutral position, and no hand is found on the selling one.
The moving averages indicator is displaying favorable results for the buyers as well with a strong bullish signal. There are 15 indicators on the buying position while zero indicators are on the selling as well as neutral positions. The Oscillators are giving a bullish signal with nine indicators at the neutral level, two indicators at the buying level, and zero indicators at the selling level.
Monero price analysis conclusion
The one-day and four hours Monero price analysis are dictating a rise in XMR/USD price. The bulls have lifted the price to the $272.41 mark in the last 24 hours, and a further price increase can be expected for the coming week. The hourly prediction is not encouraging, which means that the price might go down in the next few hours.
Disclaimer. The information provided is not trading advice. Cryptopolitan.com holds no liability for any investments made based on the information provided on this page. We strongly recommend independent research and/or consultation with a qualified professional before making any investment decisions.