Tezos and AAVE prices are relatively weak, crumbling under pressure. XTZ could fall to $4.5 while AAVE is bearish below $350.
Tezos (XTZ)
The self-amending smart contracting platform uses XTZ as its primary currency.
Past Performance of XTZ
The Tezos coin is under pressure even in the face of trader optimism.
At the time of writing, the XTZ technical analysis of the daily chart points to weakness. Bears are on top, and the Tezos token is trading in a bear breakout pattern.
Day-Ahead and What to Expect
Overall, XTZ crypto sellers are in control.
From the daily chart, the XTZ/USDT chart points to fragility and the possibility of more dump down below $5.5.
If XTZ token sellers flow back, forcing the coin below $5.5 for new November 2021 lows, Tezos may slide to $4.5 in the short term.
On the flip side, there would be relief above $6.6 and the middle BB if bulls flow back, supporting prices.
Tezos Technical Analysis
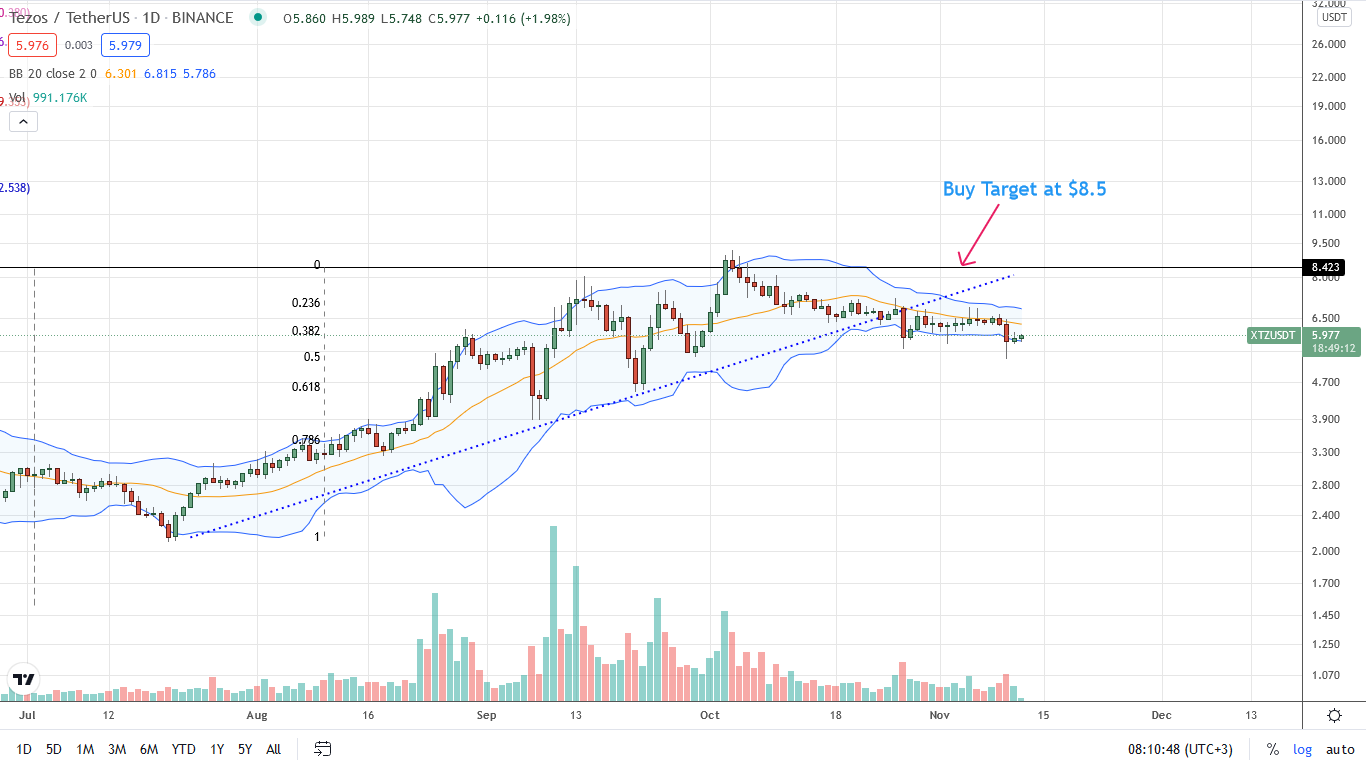
As per the XTZ/USDT price chart in the daily chart, there is a signal of weakness from a volume analysis perspective.
Confirmation of November 10 losses may force sell bars to align with the lower BB.
In that case, every correction higher may offer entries for sellers targeting $4.5—the 61.8 percent Fibonacci retracement level of the H2 2021 trade range.
AAVE
The DeFi platform is a leading lending and borrowing platform in Ethereum using AAVE for governance.
Past Performance of AAVE
The AAVE token is flat-lining as per the coin's price action in the daily chart. In the sessions ahead, buyers may find support at $300—the October 2021 lows—and later $260.
Day-Ahead and What to Expect
Technically, AAVE/USDT is bullish and within the Q3 2021 trade range.
For buy trend resumption and alignment of price action in favor of buyers, there must be a close above $350.
As a result, AAVE crypto buyers might have the momentum to thrust prices towards $430—the H2 2021 highs.
AAVE Technical Analysis
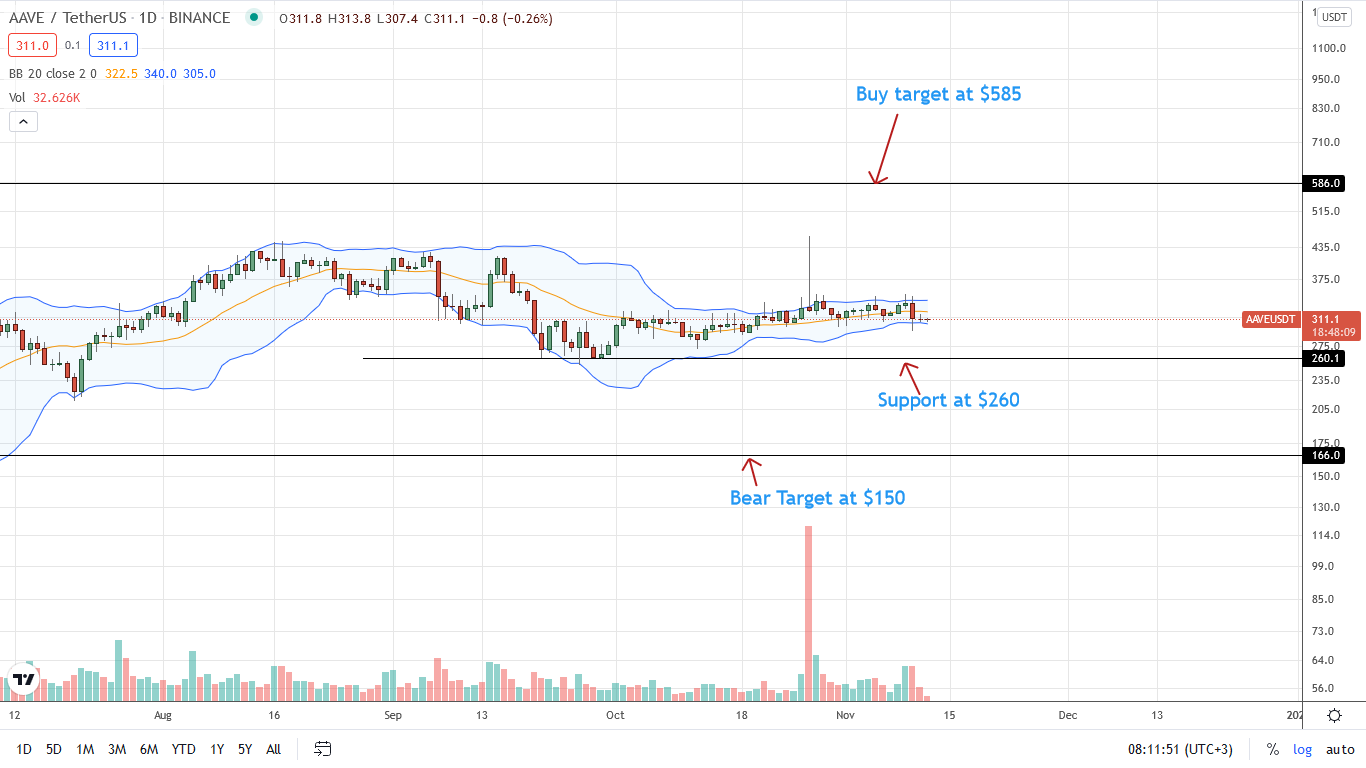
There is a three-bar reversal pattern that may point to sellers and the probability of AAVE dropping below $300 if confirmed.
As such, risk-off traders may unload the token on pullbacks targeting $260.
However, a price rally above $350 would cancel selling pressure.
In that case, AAVE/USDT may find the base to rally back to Q3 3021 highs of $430.