- Dogecoin price analysis is bearish today.
- Indicators are bearish on DOGE.
- The RSI indicates a score of 52.17, suggesting that the market is somewhat undervalued.
Dogecoin‘s price fell by 18% during the day, continuing its downward trend for the fourth consecutive intra-day trade. The price climbed to $0.338 at the end of last month and has been subjected to traders taking profits ever since. Furthermore, the emergence of Shiba Inu as the top meme cryptocurrency has left Dogecoin in the dark amid increased pressure.
SHIB, on the other hand, shot up almost 1000 percent at the end of the month, briefly surpassing DOGE in terms of market volume. With Dogecoin’s price continuing to fall, traders’ sentiments for meme-coin prices are increasingly being swayed by SHIB, which holds the key to investor sentiment for meme-coin prices at the moment.
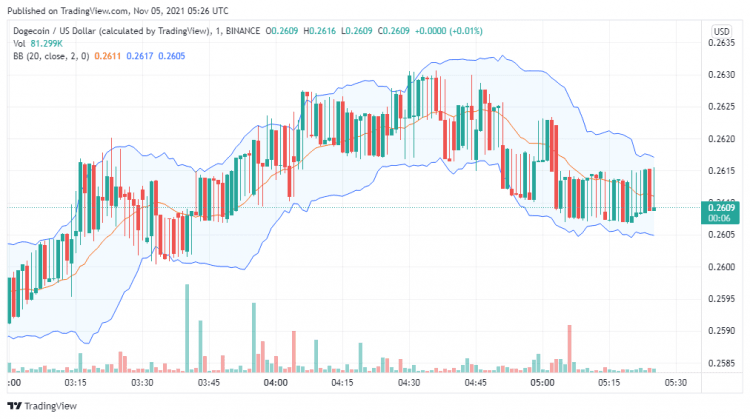
DOGE/USD 24-hour chart: Price stagnancy causes the price to move below crucial EMAs
On the Dogecoin price 24-hour chart, the price appears to be falling below the critical 20 and 50-day Exponential Moving Averages (EMAs), with declines continuing. The Relative Strength Index (RSI) indicates a score of 52.17, suggesting that the market is somewhat undervalued. Price is presently close to the middle Bollinger Band, which is the indicator of price volatility.
Dogecoin price continued its downward trend for the fourth consecutive intraday trade, slipping by more than 18 percent, despite closing at $0.338 at the end of last month. With trading volumes dropping almost twice as much, neither bulls nor bears showed any signs of taking charge of the market.
Dogecoin is currently trading at $0.2 with a market cap of $830 million, and its trading volume has declined by 18 percent. Meanwhile, Dogecoin’s market share has dropped to just 1 percent of the cryptocurrency world’s total market cap.
DOGE/USD 4-hour chart: Price aims for Bullish Hammer pattern amid weak technical indicators
On the 4-hour chart, the price can be seen attempting to rise over the last two trading sessions. This constitutes a minor Bullish Hammer pattern, where buyers have come in late into the market to rescue the declining price. However, the price still sits below crucial EMAs, and the RSI value of 45.55 does not present a positive reading for DOGE bulls. Furthermore, the Moving Average Convergence Divergence (MACD) line has dipped below the neutral zone and sits under the 0.00 mark. Amid weak technical indicators, the price can only change course to consolidate momentum over the subsequent few short-term trading sessions.
Dogecoin price analysis: 4-hour chart. Source: Trading View
However, Dogecoin slipping under $0.20 has opened new opportunities for traders to enter into Dogecoin at attractive prices. Although the day’s trading volume dropped by 18 percent, it seems that neither bulls nor bears are willing to take charge just yet.
Dogecoin slipped more than 3 percent on intra-day trade. Trading volume declined by 18%, suggesting market stagnancy at this current trend. Shiba Inu’s emergence as the top “Dog” cryptocurrency puts Dogecoin under increased pressure. Dogecoin is currently trading at $0.2.
Dogecoin price analysis: Conclusion
Dogecoin is currently the shortest in the meme-coin rivalry, with Shiba Inu taking DOGE in nearly every category. The falling price has put the price on hold, and the current downturn’s depth is unknown. It may be an excellent moment for buyers to enter the market as the price approaches the $0.253 support floor.
Disclaimer. The information provided is not trading advice. Cryptopolitan.com holds no liability for any investments made based on the information provided on this page. We strongly recommend independent research and/or consultation with a qualified professional before making any investment decisions.