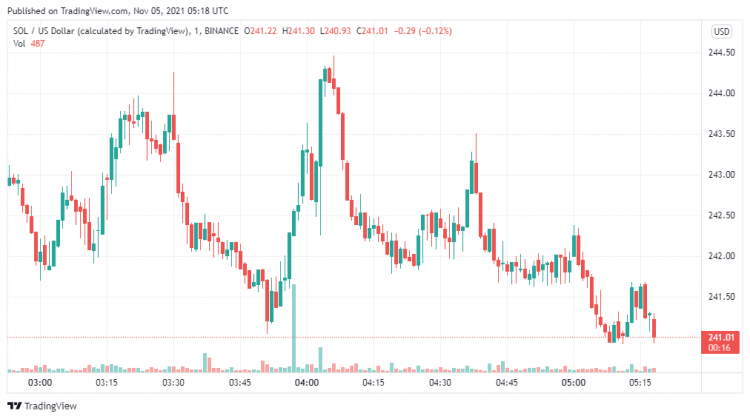
- Solana is trading at $242.
- Solana price was bearish towards the closer of yesterday’s price analysis.
- Today Solana price analysis is bullish.
Solana price was bearish towards the closer of yesterday’s price analysis. This trend was however altered in today’s price analysis as The market began in bullish momentum.
It is clear that we are at a bullish momentum, and we may see some climb in the value of Solana. However, The market has maintained stability but not to an extent where investors can consider huge investments.
There is a support at $242. This support has been tested but has not failed. Thus, the market will likely continue to trade around this value for some time now before considering it bullish or bearish.
Solana price analysis on the hourly charts: Dropping market choppiness
On the 4-hour chart, the choppiness index has dropped from 60 to 40, suggesting that the market may move in a single direction. The bulls appear to be in control at this time. As a result, we reaffirm our bullish view that Solana’s price will rise in the coming sessions.
The chart shows that the 5-day moving average is well below the 10-day moving average, which means that the path of least resistance is the upside. We may see a short retracement in the session, but this won’t change our price increase.
Solana price analysis on daily charts: Sideways trading
On the daily charts, we can see that Solana is trading sideways. However, the bulls seem to be gaining momentum and could soon take control of the market and push the price above $240 and $242. The 10-day moving average is below and slightly below the 26-day moving average, suggesting that it will likely rise in the coming sessions.
After a recent price jump, Solana seems to have been trading sideways around the $240-$242 range, which is a strong support/resistance line. If bulls regain strength and push above this level, we may see further gains towards the Fibonacci retracement level of $250 before any major correction.
Solana four-hour price chart: Hitting Resistance
On Solana’s four-hour chart, we can see that price has hit resistance at $245. This may be used as support, but it won’t hold for long if bulls do not push prices higher than $245 in quick succession. A pullback to $240 is possible before higher prices are likely seen.
The four-hour chart shows that Solana has hit resistance at $245 and may fall back to support at $240-$242 if bulls do not make an immediate impact. Overall, our view remains bullish as long as Solana is trading above $240.
The 15-min chart shows that Solana has been trading in a bullish pattern, for now, supported by the two EMAs(12, 26) and RSI(14). This means that bulls remain in control and could push the price above $245 soon.
Solana Price Analysis: Conclusion
Solana’s price rose significantly during the day, reaching a new all-time high of $231 this afternoon. Because of this circumstance, the bears were scattered throughout the market. As a result, we anticipate that Solana’s value will continue to climb and eventually reach $250 as intended.
Disclaimer. The information provided is not trading advice. Cryptopolitan.com holds no liability for any investments made based on the information provided on this page. We strongly recommend independent research and/or consultation with a qualified professional before making any investment decisions.