Qtum (pronounced ‘“quantum”) is a proof-of-stake (PoS) smart contract open-source blockchain platform and value transfer protocol. It aims to bring together the strengths of Bitcoin and Ethereum in one chain. Patrick Dai is the project’s founder and the chairman of the Qtum Foundation. The other two co-founders are the CTO and blockchain architect Neil Mahi and lead developer Jordan Earls.
Let us look at the technical analysis of QTUM.
Past Performance
QTUM opened at $13.05 on October 25, 2021. A week later, on October 31, 2021, the price closed at $15.78. Meanwhile, in the last 24 hours, the highest and the lowest price was $16.35 and 12.96, respectively. The weekly change was 20.91%.
Source: https://www.tradingview.com/x/KHNbcQuY/
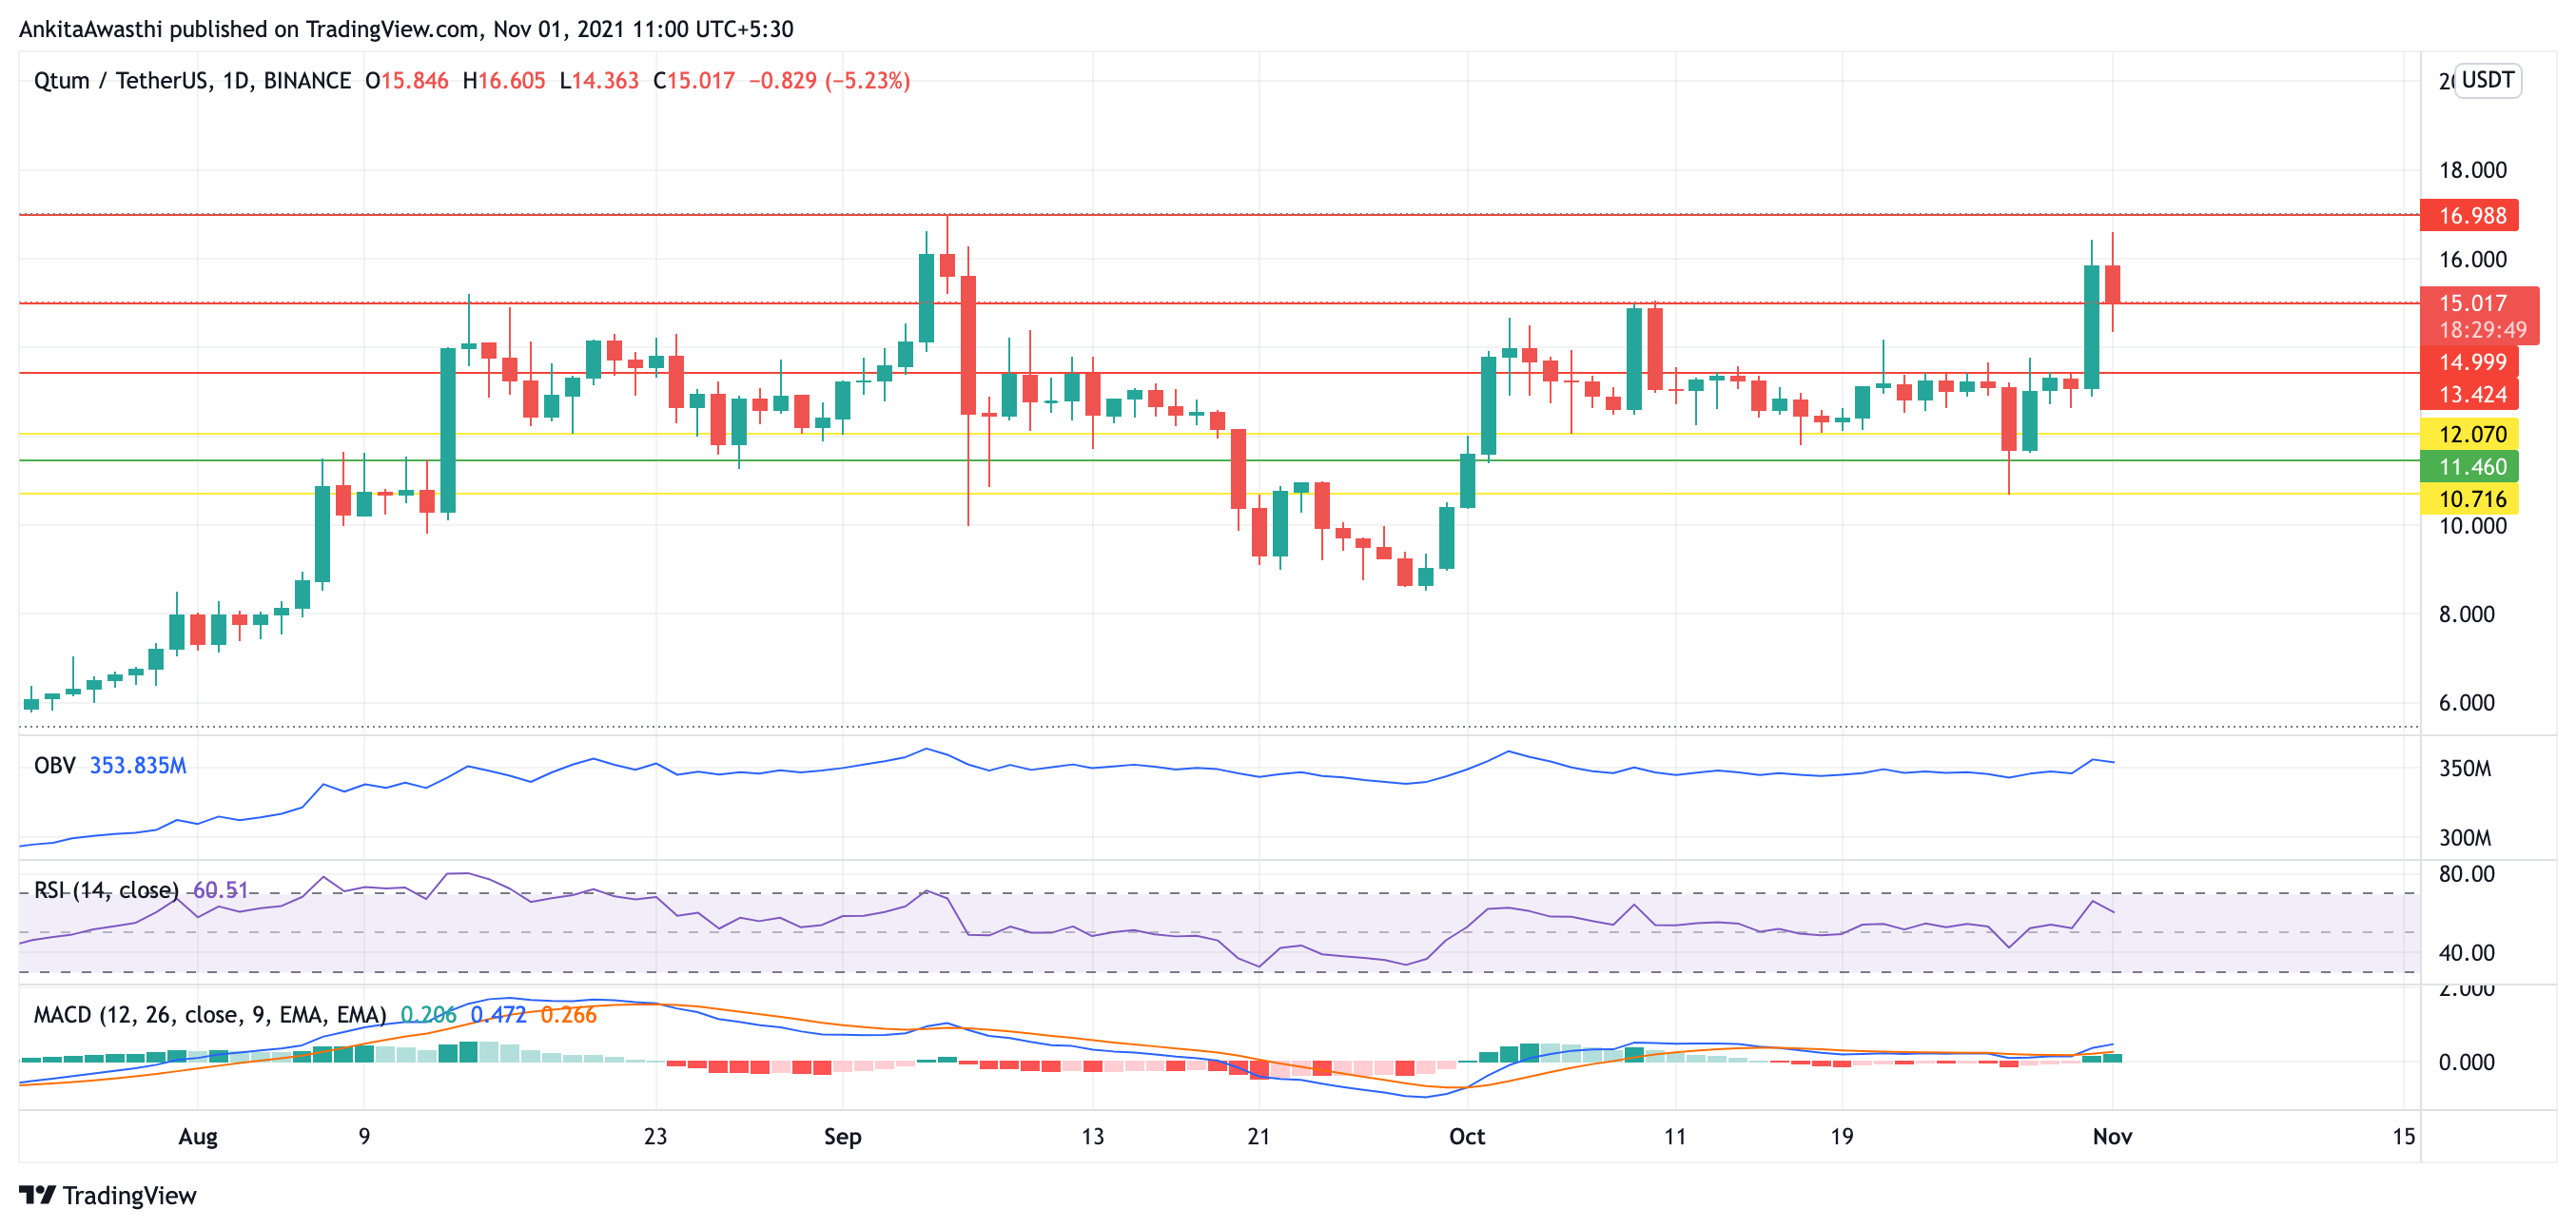
QTUM Technical Analysis
The trading price can be seen to be relatively stable in the past, after which fluctuations were seen during the last week. The price broke the first support at $12.07 and took the next support at $10.716. It then rose high to break the resistance levels at $13.424 and $15. It has also successfully crossed the resistance at $15.066. The next resistance to be tested is at $16.98. These are signals for a bullish trend.
On Balance Volume is an indicator that predicts the price movement based on the direct buying and selling volumes of all the traders combined. It is showing that the buying volume has just begun to become lower than the selling volume. This can be a signal that the ongoing uptrend may reverse itself.
The current trading price is $15.08, which is 4.83% down as compared to yesterday. This is again a negative signal, but QTUM has a lot going on for itself.
RSI is also showing a reversal in the direction of its graph. This is a red flag, signaling traders to take a short position.
MACD is showing that the fast line is having an incline. This is because MACD is a lagging oscillator, and it is confirming the previous week’s increase in prices. However, no divergence can be seen from the price chart in the MACD graph.
Amidst the ongoing uptrend, QTUM has announced a launch of a new brand named “Quantum.” It is scheduled to be unveiled this year. Technical indicators for QTUM hints towards a bullish trend.
Day-Ahead and Tomorrow
FIB Retracement shows that the QTUM price took support at the FIB level of $11.74. The next pivot to be tested is at $17.75.
The oscillators are signaling a trend reversal. Thus, the traders may take a short position while keeping the stop-loss at $11.46. However, we cannot rule out the possibility of the uptrend continuing. If the price breaks the next resistance, the uptrend may continue.