An analysis of seven cryptocurrencies, including Bitcoin (BTC), which has just reached a new all-time high price, and Ethereum (ETH), which also managed to do so.
BTC
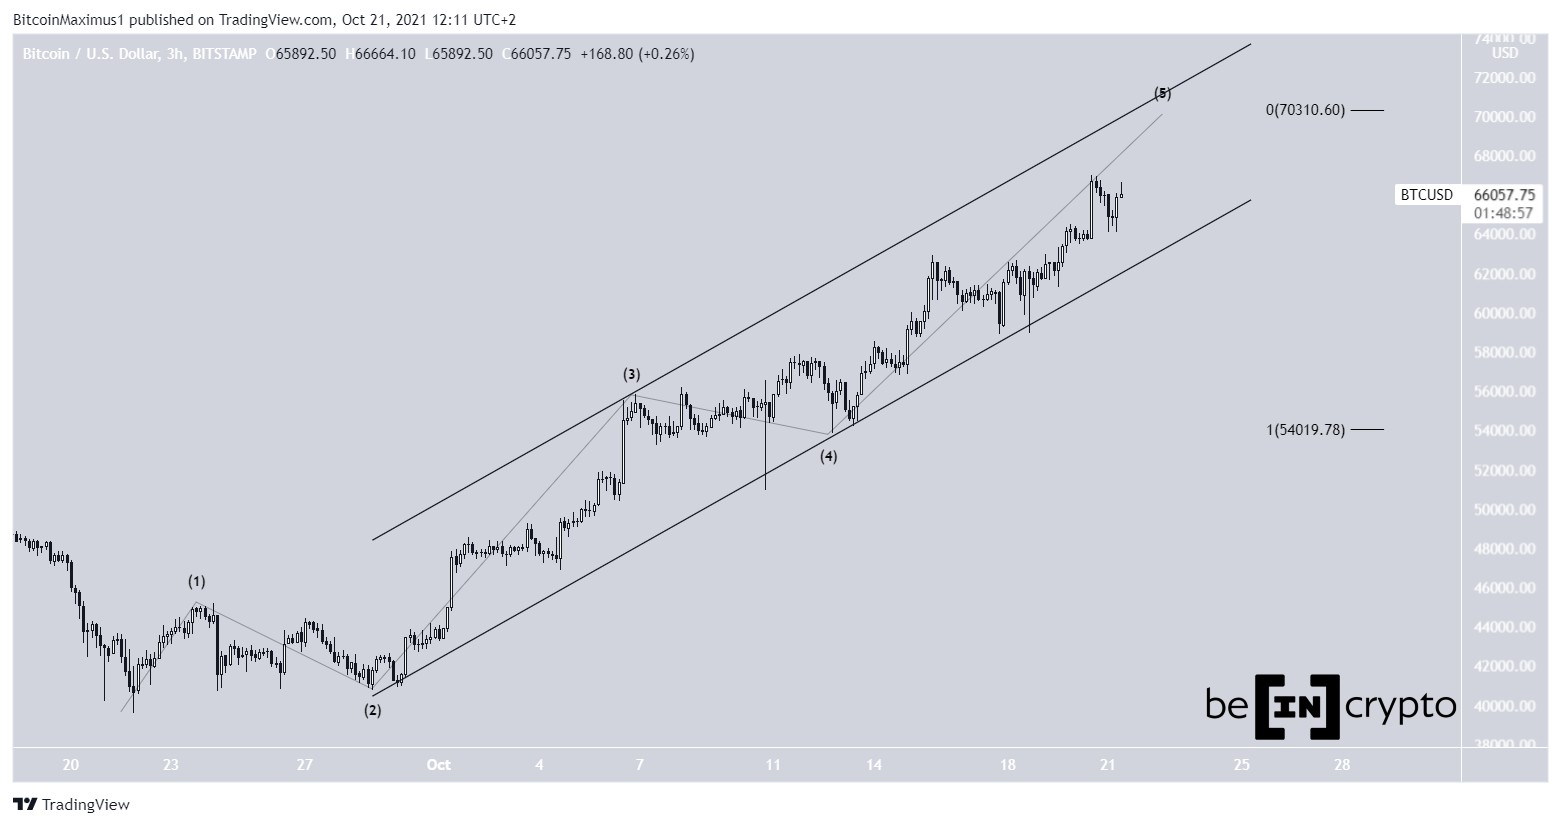
BTC is trading inside an ascending parallel channel. It has been doing so since Sept 29, when the upward movement accelerated.
Also, it seems that BTC is in a bullish impulse, which means an upward movement that has five distinct waves. It is currently in the fifth and final wave.
The channel is created by connecting the lows of waves two and four with the high of wave three. Very often, the high of wave five falls inside this channel. The resistance line of the channel is currently at $70,000.
Furthermore, a target at a similar level is found by projecting the length of waves one and three. Therefore, there is confluence for a top to be reached near $70,000.
ETH
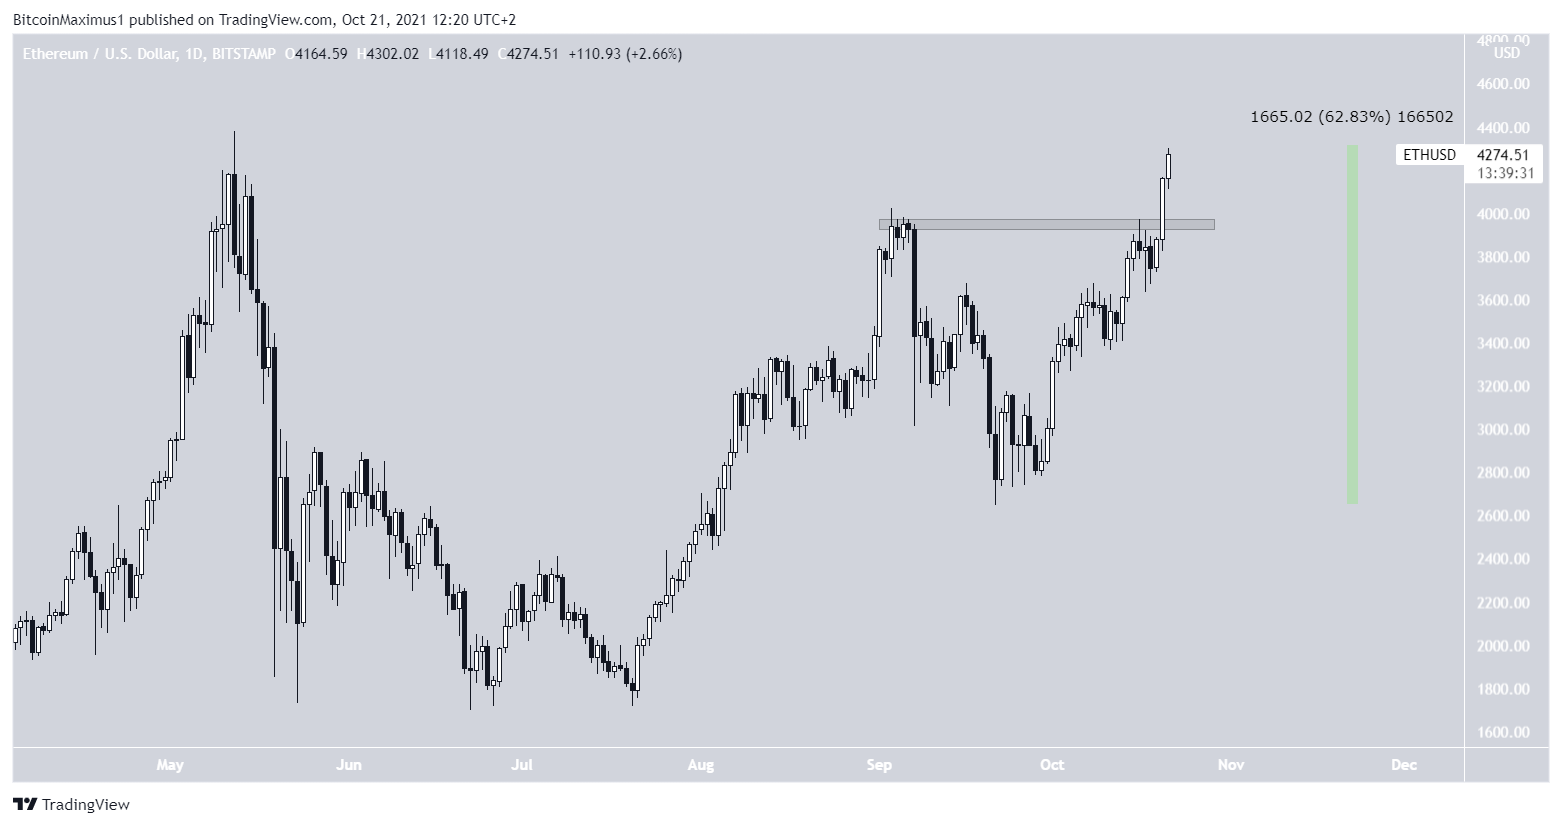
Ethereum (ETH) has been moving upwards since Sept 21, when it reached a low of $2,650. Since then, it has increased by nearly 63%.
More importantly, ETH broke out above the $3,960 resistance level on Oct 20. The resistance previously stood since Sept 2. Its breakout is a very bullish since there is no more resistance left until the all-time high of $4,380.
BTC did reach a new all-time high, and ETH is expected to do so soon, if it has not already.
XRP
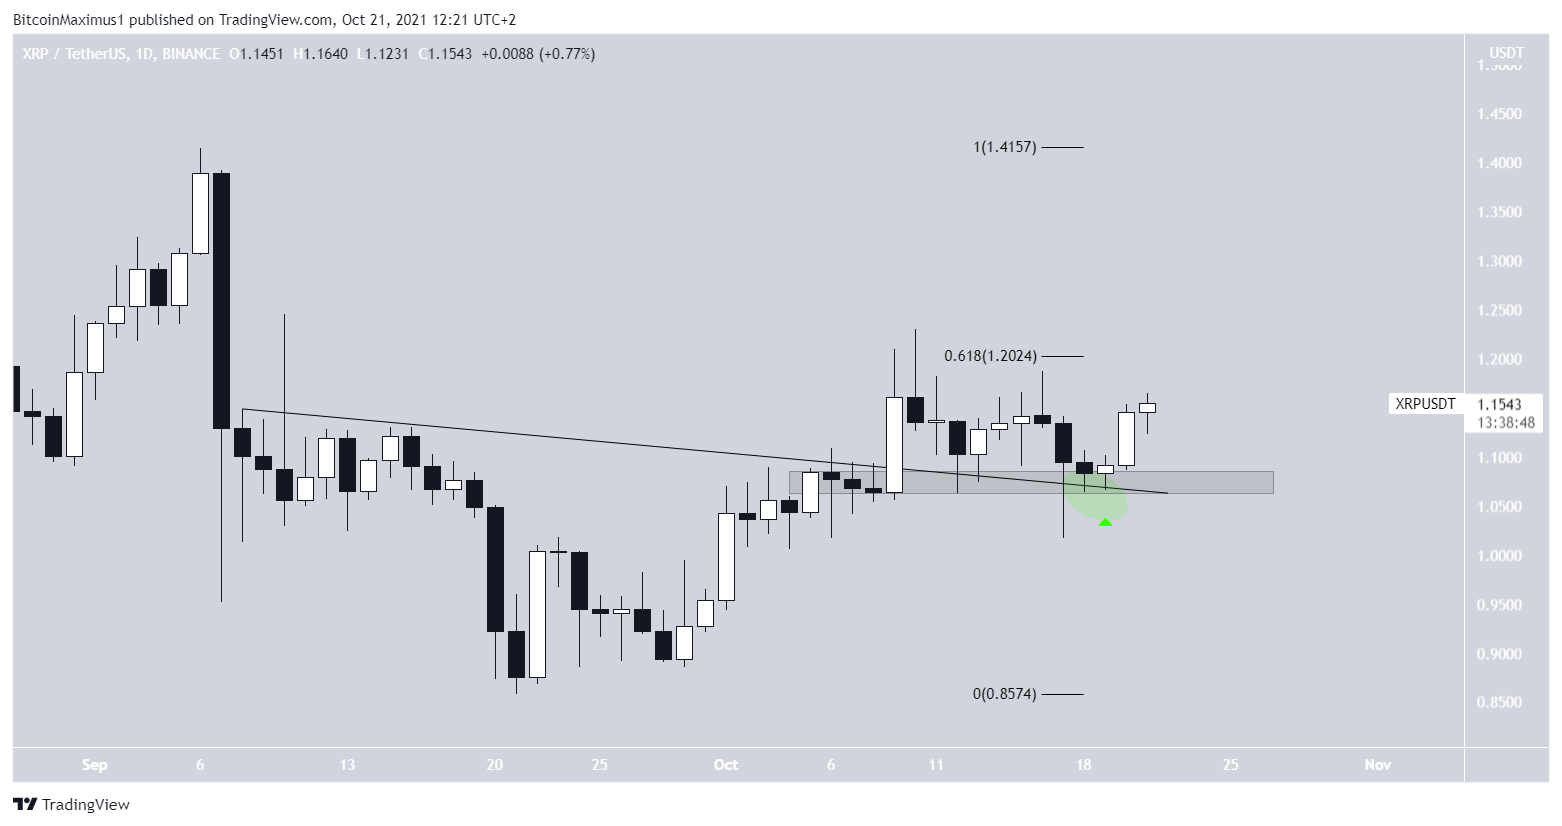
On Oct 9, XRP (XRP) broke out from a descending resistance line. This confirmed that the downward movement in place since Sept 8 had come to an end.
However, it failed to sustain its upward movement and was rejected by the $1.20 resistance, which is the 0.618 Fib retracement resistance level.
Afterwards, it bounced at a confluence of support levels, created by the $1.08 area and the previous descending resistance line. In the future, the line is expected to act as support.
If XRP were to move above the $1.20 area, the rate of increase would be expected to accelerate.
OMG
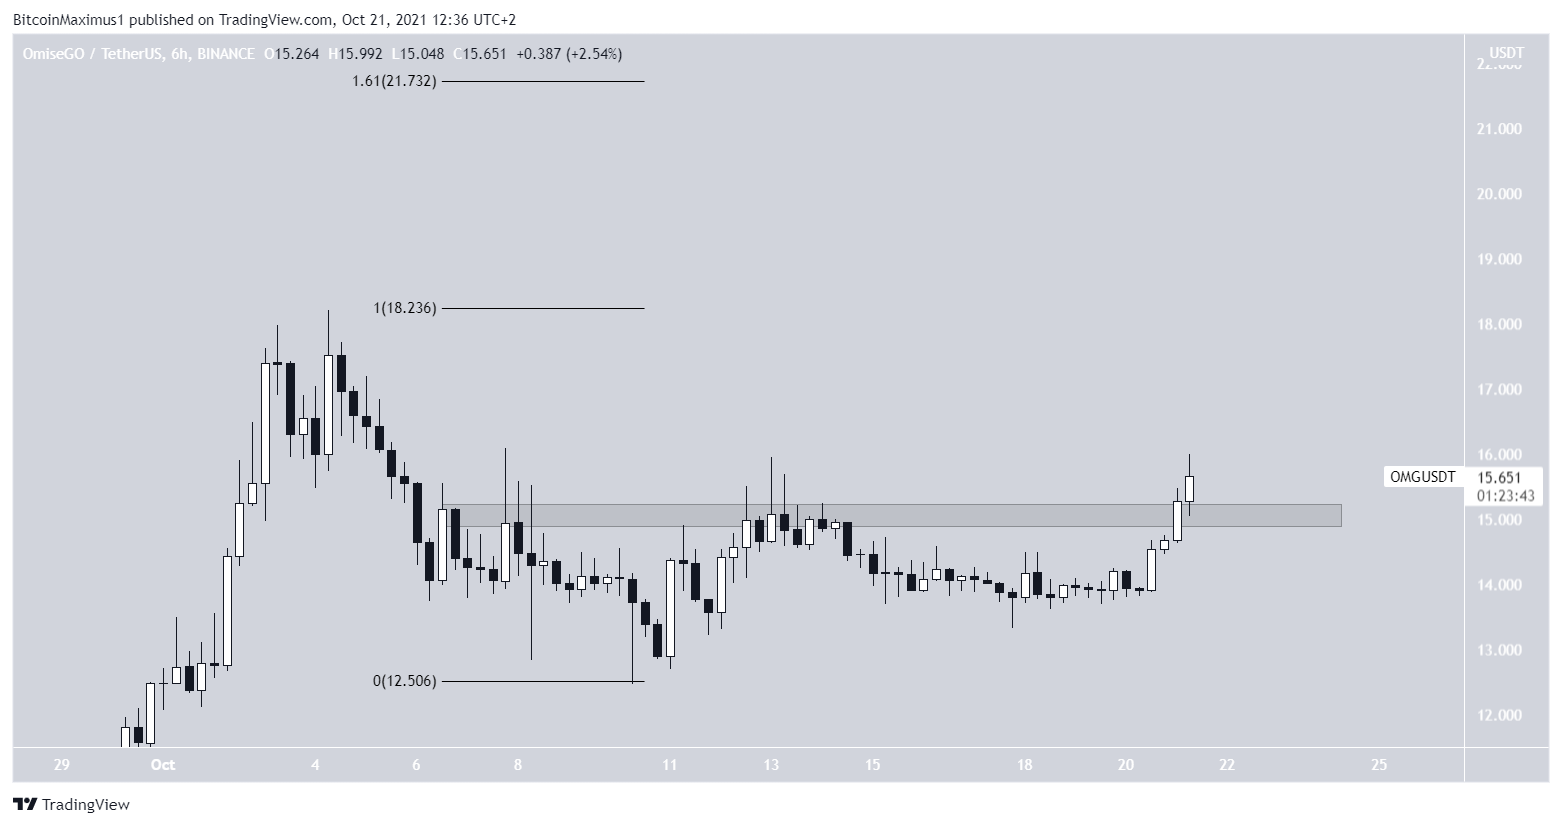
OMG Network (OMG) has been moving upwards since Oct 10. However, it was rejected by the $15 resistance area on Oct 13, thwarting the initiation of the upward movement.
Nevertheless, after another decrease, OMG was successful in breaking out on Oct 21.
The next closest resistance area is at $18.20, created by the current all-time high price.
If the token is successful in moving above it, the next resistance area would be at $21.70, the 1.61 external Fib retracement resistance level.
Whenever a token is at an all-time high, such Fib levels are used in order to find resistance areas.
ENJ
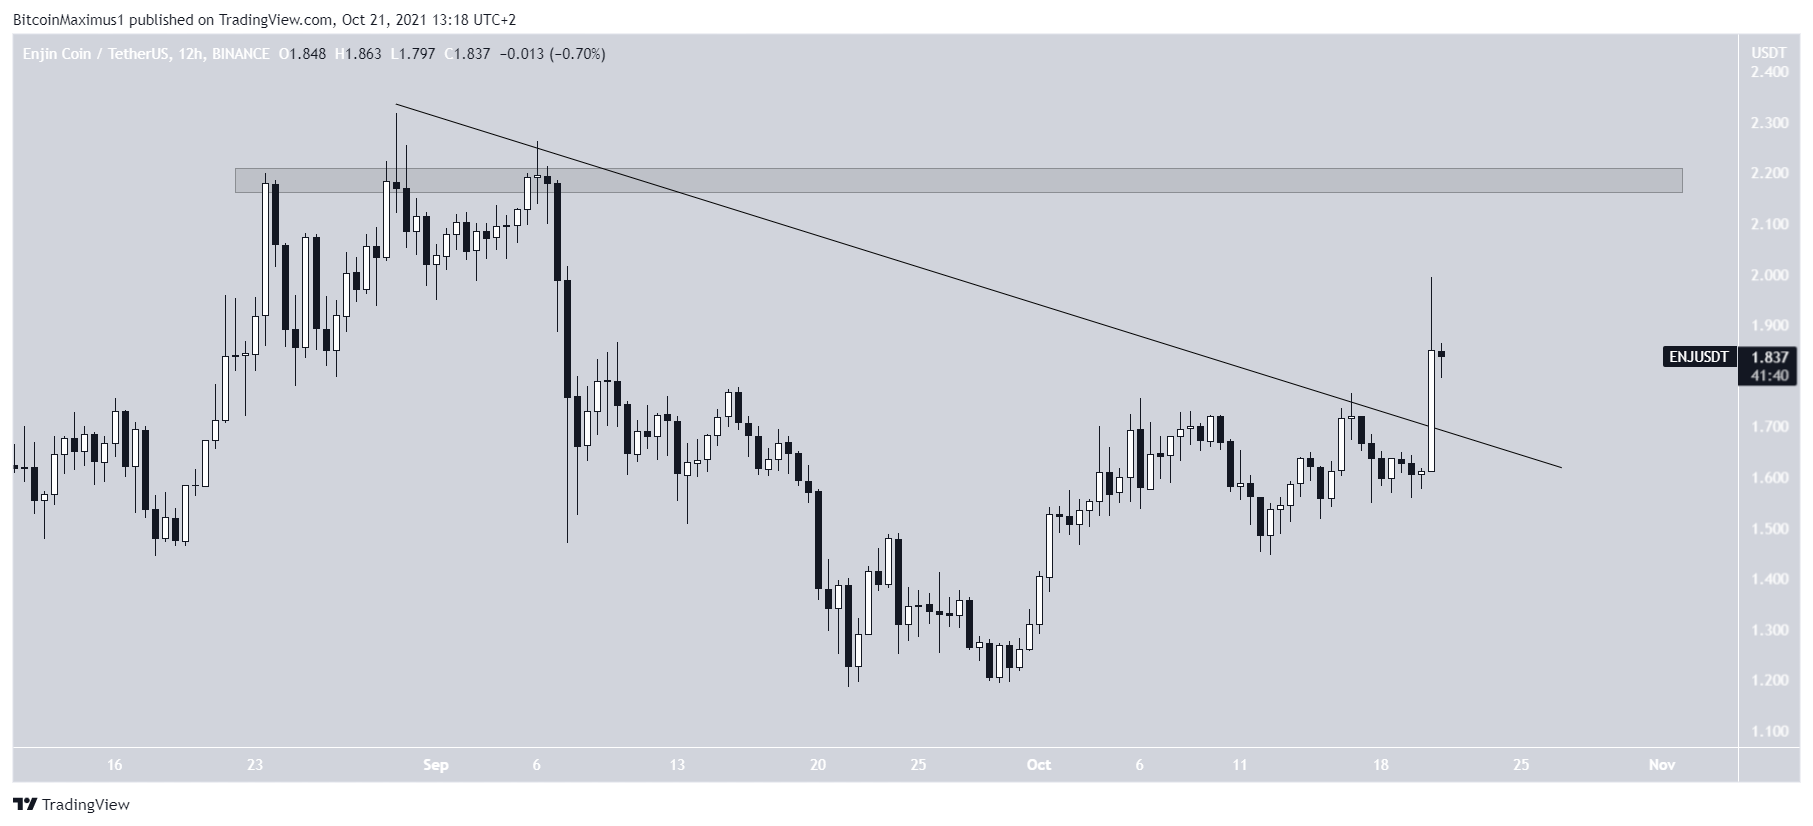
Enjin Coin (ENJ) had been decreasing alongside a descending resistance line since Aug 30. While doing so, it reached a low of $1.18 on Sept 21.
However, it reversed trend afterwards and proceeded to break out on Oct 20. This indicated that the downward movement had come to an end.
The next resistance area is at the Sept highs near $2.20.
DASH
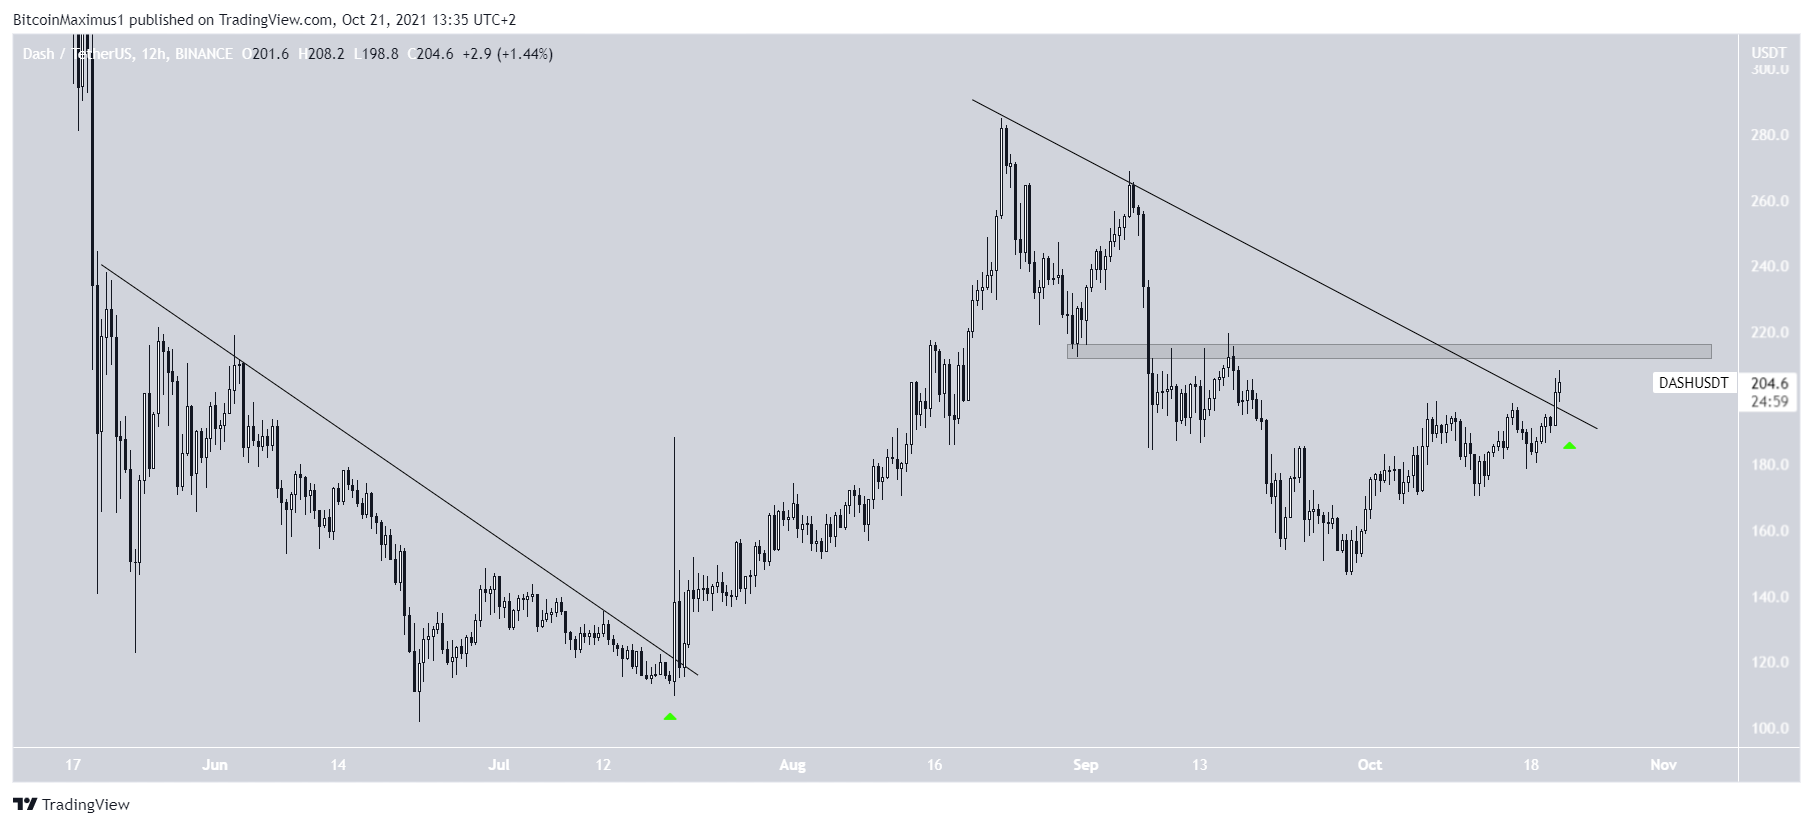
DASH had been decreasing alongside a descending resistance line since Aug 23. This led to a low of $146.3 on Sept 28.
However, the token reversed trend shortly afterwards and broke out from the descending resistance line on Oct 20 (green icon).
The previous time this occurred, DASH increased by nearly 3x, going from $100 to $280.
While there is horizontal resistance at $216, if DASH manages to break through it, the next resistance would be all the way at $280.
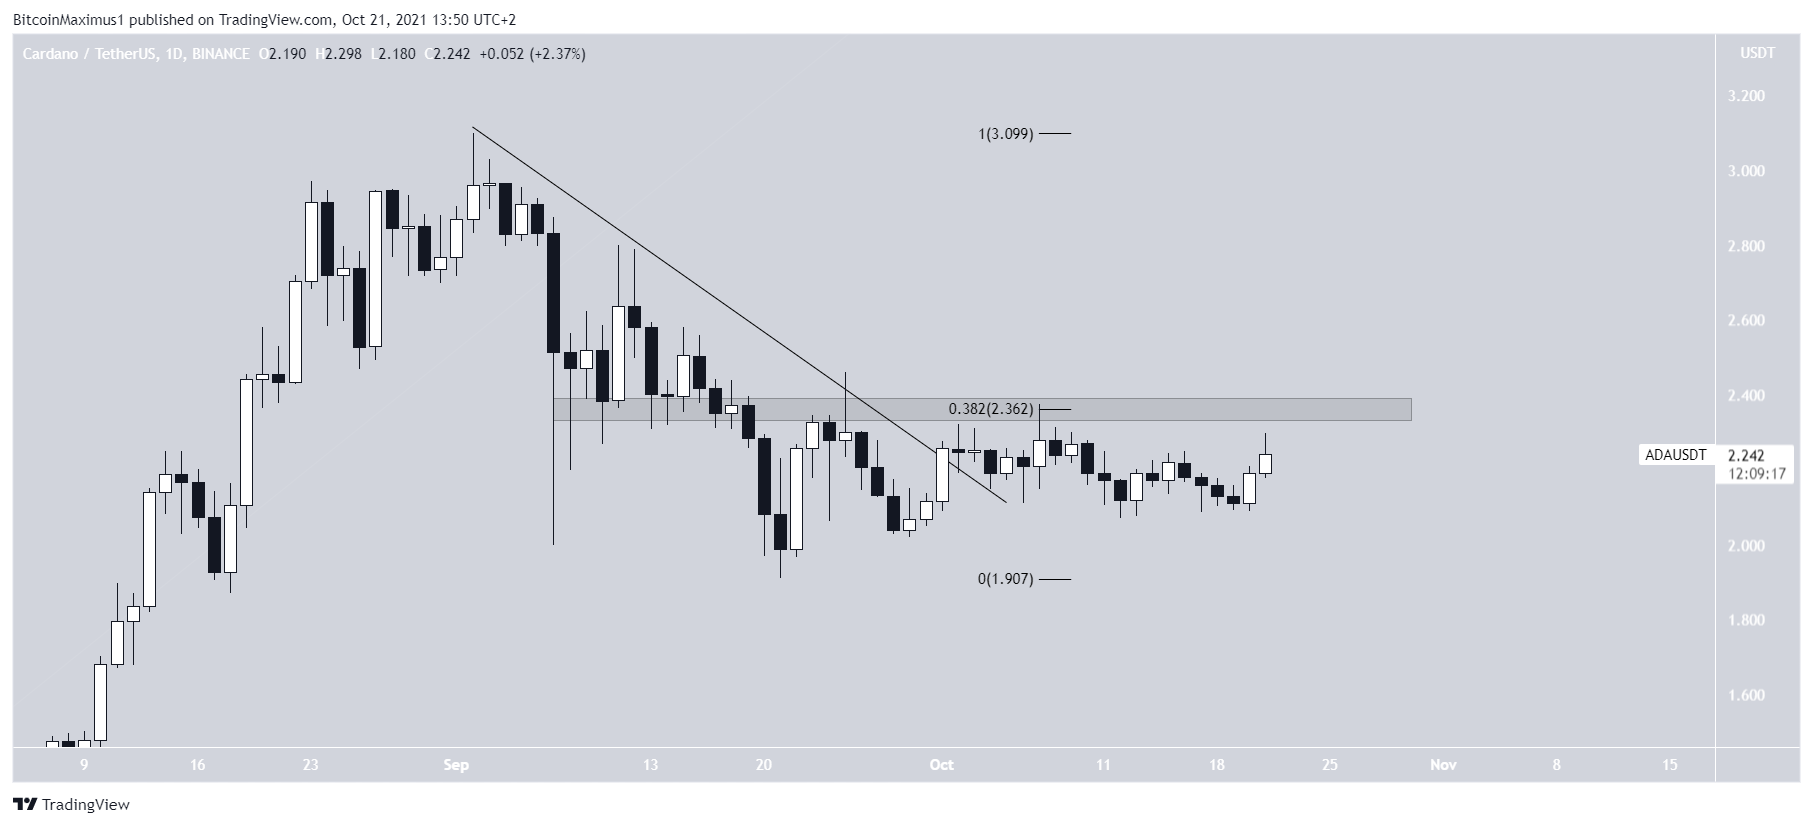
ADA
Similarly to ENJ and DASH, ADA has broken out from a descending resistance line. However, it has failed to increase above the $2.36 resistance.
This is both a horizontal resistance area and the 0.382 Fib retracement resistance level.
Until ADA manages to move above it, the trend cannot be considered bullish.