Dash is an open-source blockchain and cryptocurrency-focused on offering a fast, cheap global payments network that is decentralized in nature. According to the project's white paper, Dash seeks to improve upon Bitcoin (BTC) by providing stronger privacy and faster transactions. Dash was founded by software developers Evan Duffield and Kyle Hagan. The project was originally called XCoin, changing its name to Darkcoin two weeks later, before rebranding again to Dash in March 2015 in an effort to positively change its image. Let us look at the technical analysis of DASH.
Past Performance
DASH started trading on 13 October 2021 at $180.65. The week saw an increase in the prices. It closed on 19 October 2021 at $193.91. This was an overall change of +7.3%.
Source: https://www.tradingview.com/x/kEu1zq0M/
DASH Technical Analysis
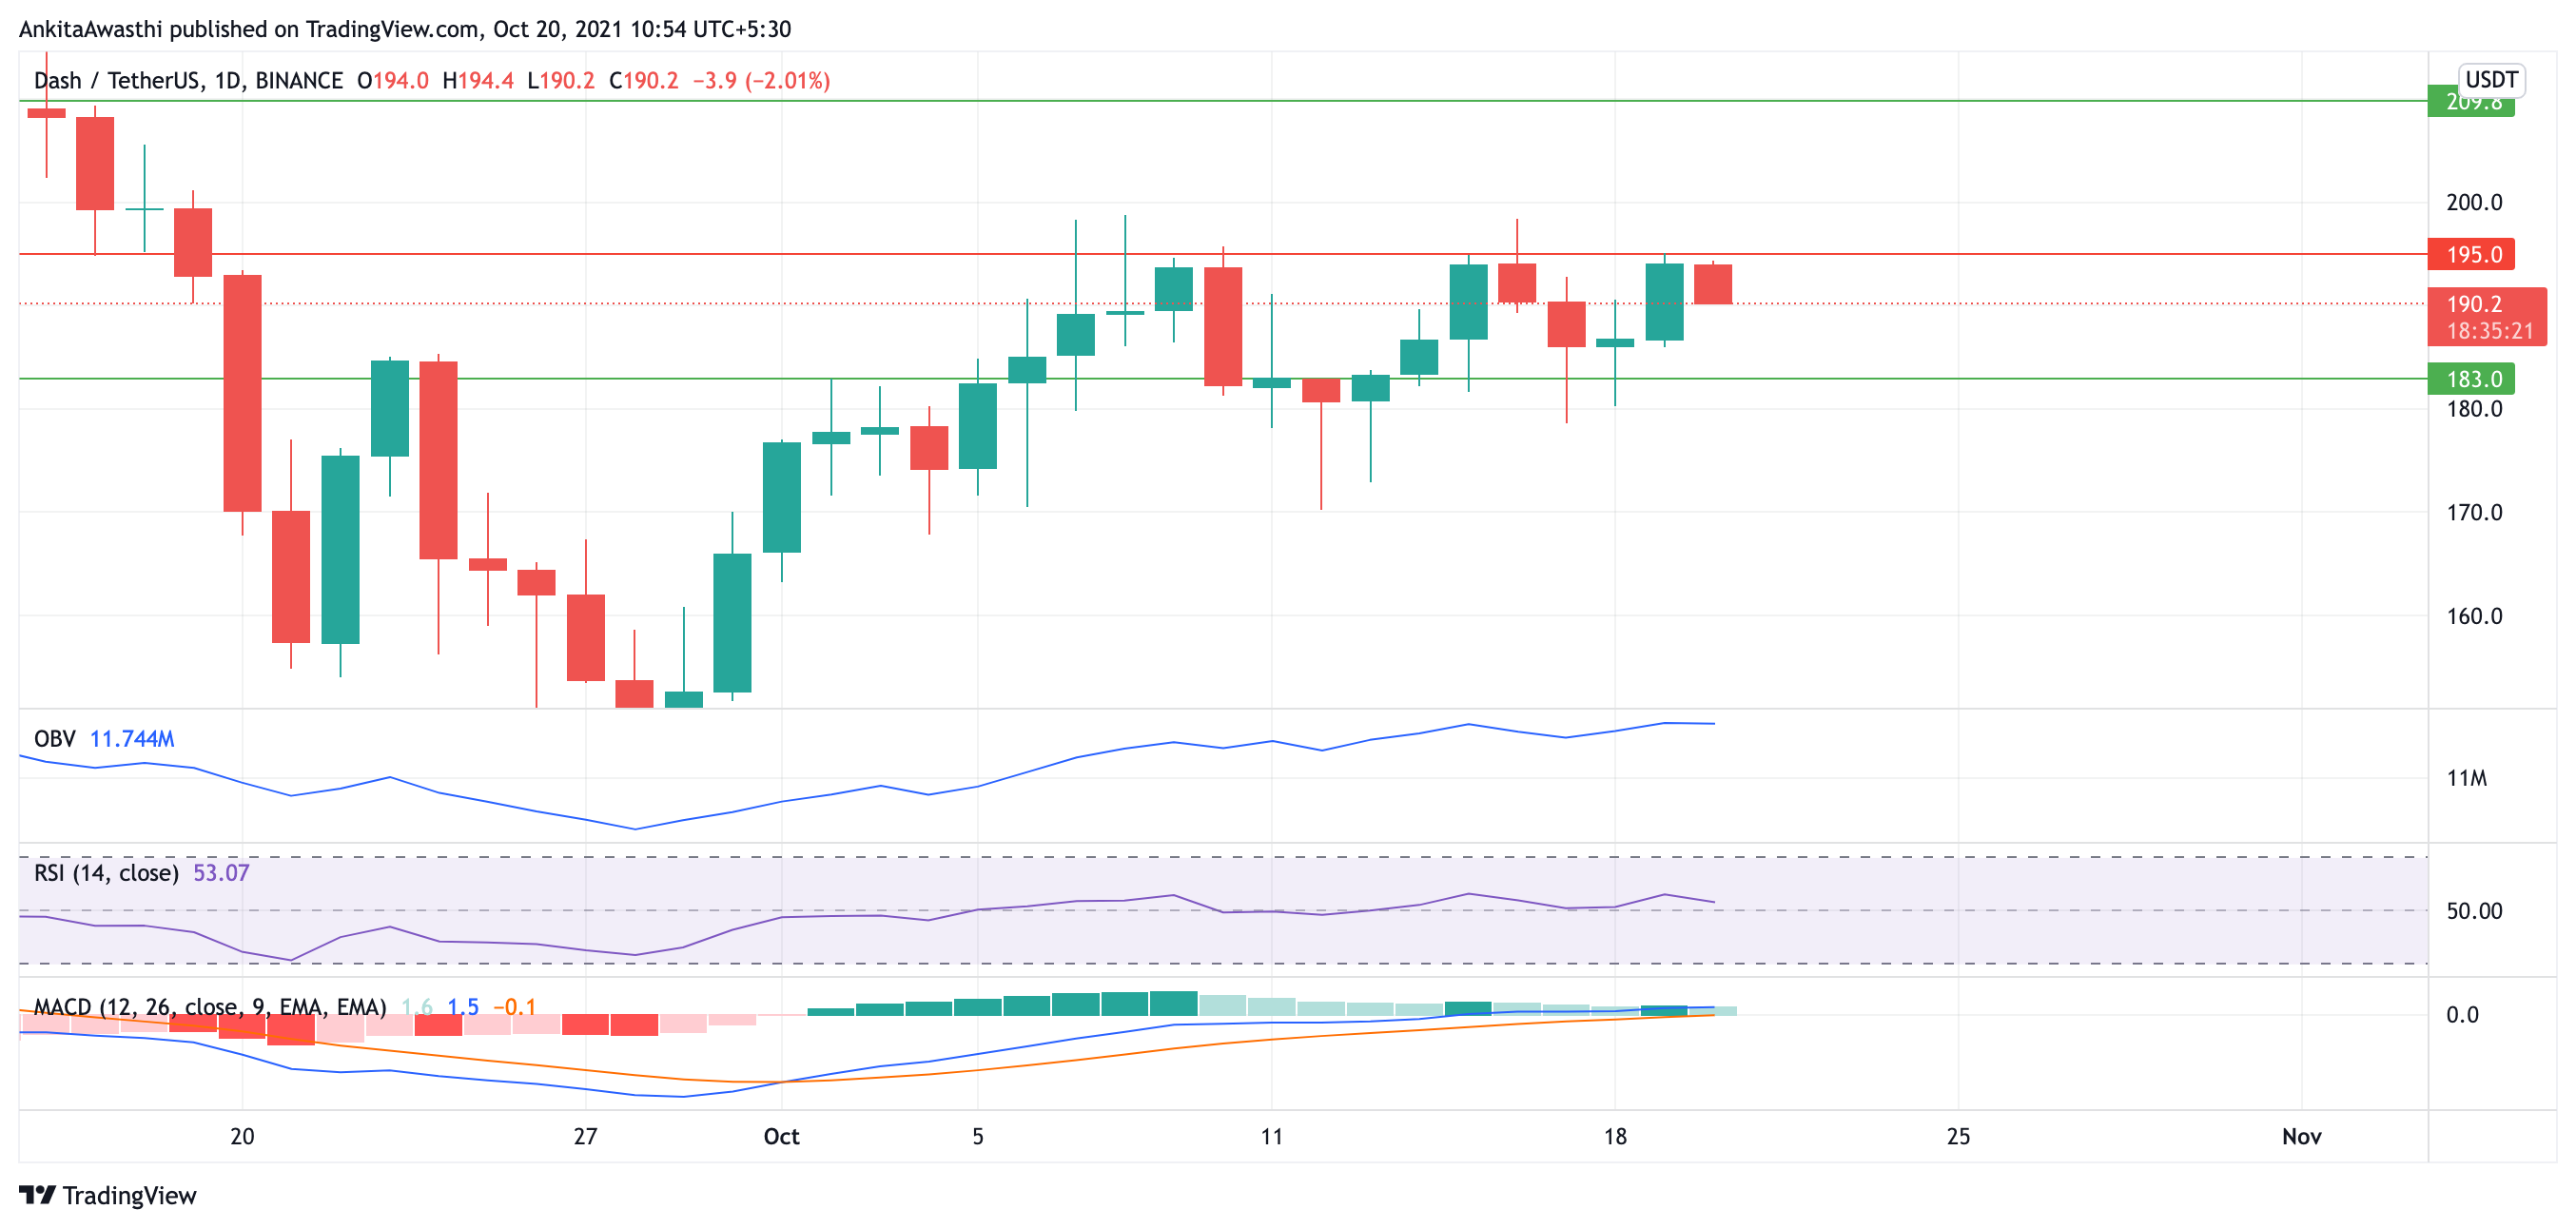
The price chart witnessed an overall increase in the price, although, there were small hills and valleys across the week. It is currently facing resistance at $195. The current trading price of DASH is $190.4 which is 1.91% down from the previous day’s close.
OBV is showing an uptrend which means that the buying pressure is dominating the selling pressure. This is a signal that the trend may break the resistance at $195 to continue the uptrend. The traders may take a long position here.
RSI is moving along the equilibrium and is currently at 53%. This is a neutral signal, meaning that the traders may hold their current positions.
MACD is showing that the fast and the slow lines have a constant gap between them, and both are heading in the positive regions. There is no divergence from the price chart. Thus, traders may take a long position.
Day-Ahead and Tomorrow
Fib retracement is showing that the price chart is currently taking support at the $186.41 fib level. The next fib level will be tested at $198.8.
Thus, the indicators are more on the bullish side, meaning that the traders may take a long position. However, the RSI is at equilibrium, which means that the price may go down as well. For long positions, the target can be kept at $209.8. The stop loss can be set at $183.