Quant was launched in June 2018 with the goal of connecting blockchains and networks on a global scale, without reducing the efficiency and interoperability of the network. It is the first project to solve the interoperability problem through the creation of the first blockchain operating system. Gilbert Verdian, one of the founders of the Quant network, had the idea for the blockchain project while he was working in the healthcare sector. Verdian identified the importance of interoperability in ensuring that patients registered on different platforms are covered. Let's look at the technical analysis for the QNT token.
Past Performance
The last week’s movement of the price chart was quite restricted. The QNT opened on 11 October 2021 at $294.3 and closed at $301.27 on 17 October 2021. Thus, there was an overall change of +2.35% across the week.
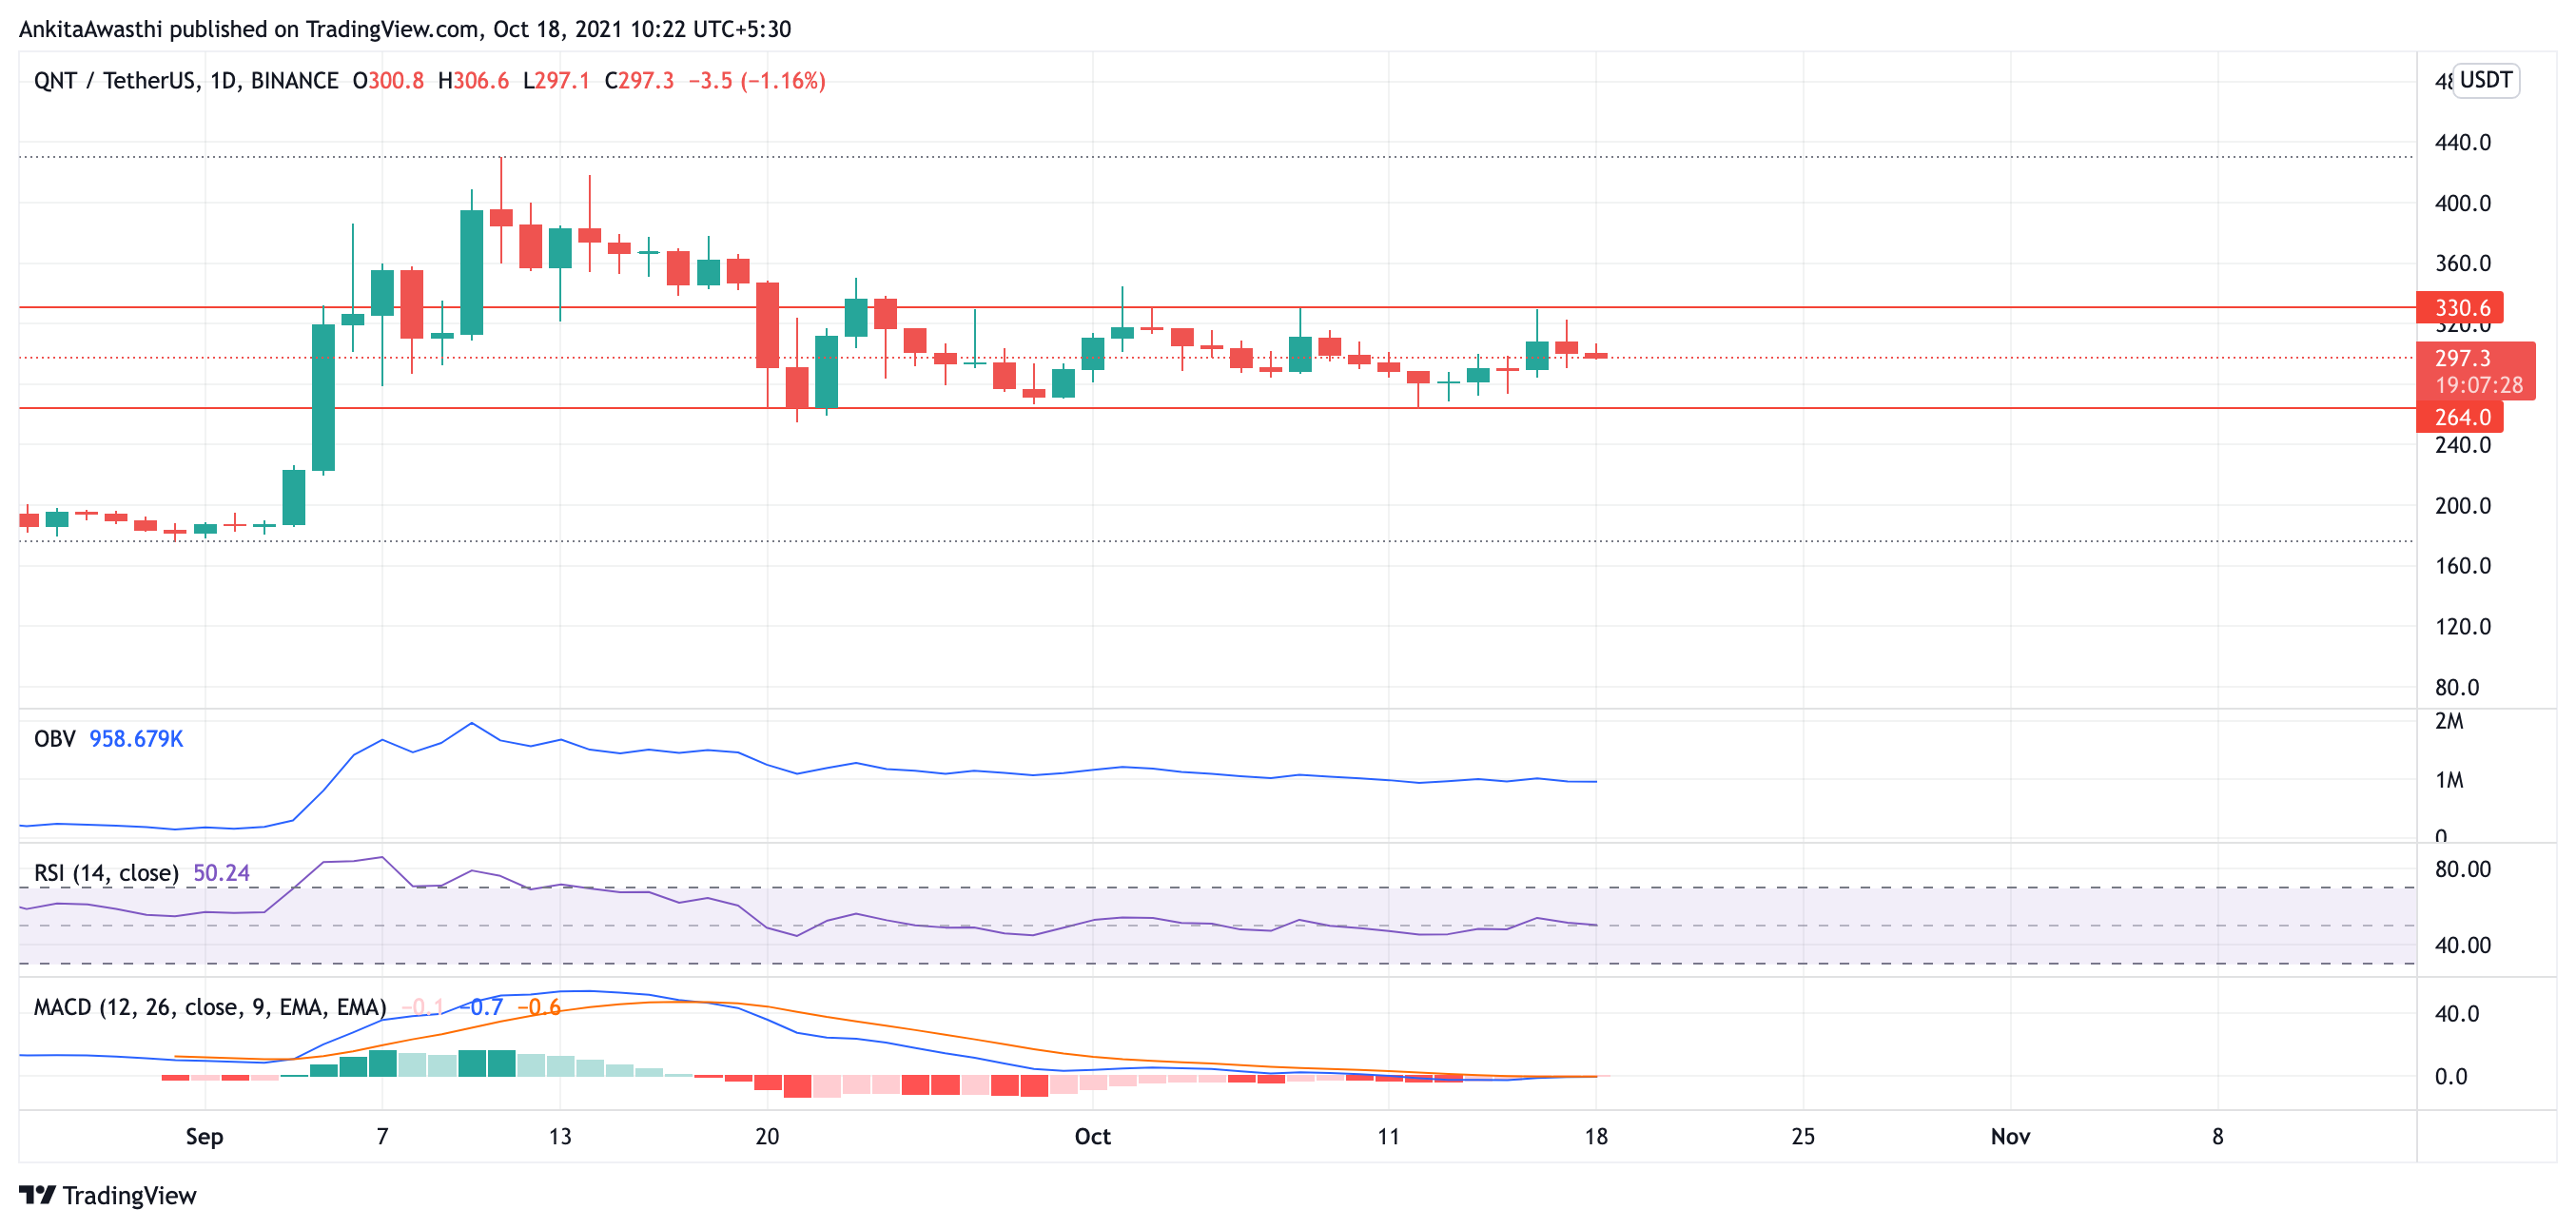
Source: https://www.tradingview.com/x/AQviA4NS/
QNT Technical Analysis
The price chart is moving inside a box for several days. The candles are restricted primarily between $330.6 and $264 levels. Also, the trend is showing continuous hills and valleys inside the box. The current trading price is $297.9, which is about 0.96% less than yesterday.
OBV is moving in a horizontal line, which means that the buying and selling pressures are balanced. This is a signal that the price will continue to remain inside the box. Therefore, traders may hold their current position.
RSI is currently at 50.24%. It is moving along the equilibrium for several days, which is again a neutral signal. This means that the price is again unlikely to fluctuate. The QNT traders may hold their current position.
MACD is confirming the chart’s movement inside a box. The fast and the slow lines can be seen converging into one another and moving closer, straight along the equilibrium line. Hence, there is no divergence from the price chart. This again signals that the traders may hold their current positions.
Day-Ahead and Tomorrow
Fib numbers show that the QNT price is moving between two fib levels of $255.1 and $329.91. However, according to fib retracement, the price is likely to break the box on the upper side.
Thus, the indicators are giving neutral signals and suggesting that the price will remain inside the box. Thus, traders may hold their current position and wait for the price to show some significant signals.