Telcoin was founded by Claude Eguienta and Paul Neuner. It was officially released in 2017, and it is an Ethereum based cryptocurrency. Tel was created for the purpose of making crypto transfers easier and faster. It is mobile-friendly, fast, and one of the most affordable cryptocurrencies out there. Telcoin was established in July 2017 in Singapore. TEL leverages blockchain technology to provide access to decentralized financial services on any mobile device.
Past Performance
On October 7, 2021, TEL opened at $0.018. The trend reversed itself and the later part of the week saw an uptrend. The week came to an end with a close at $0.020 on October 13, 2021. This was about an 11.1% change across the week.
Source: https://www.tradingview.com/x/uxznztd6/
TEL Technical Analysis
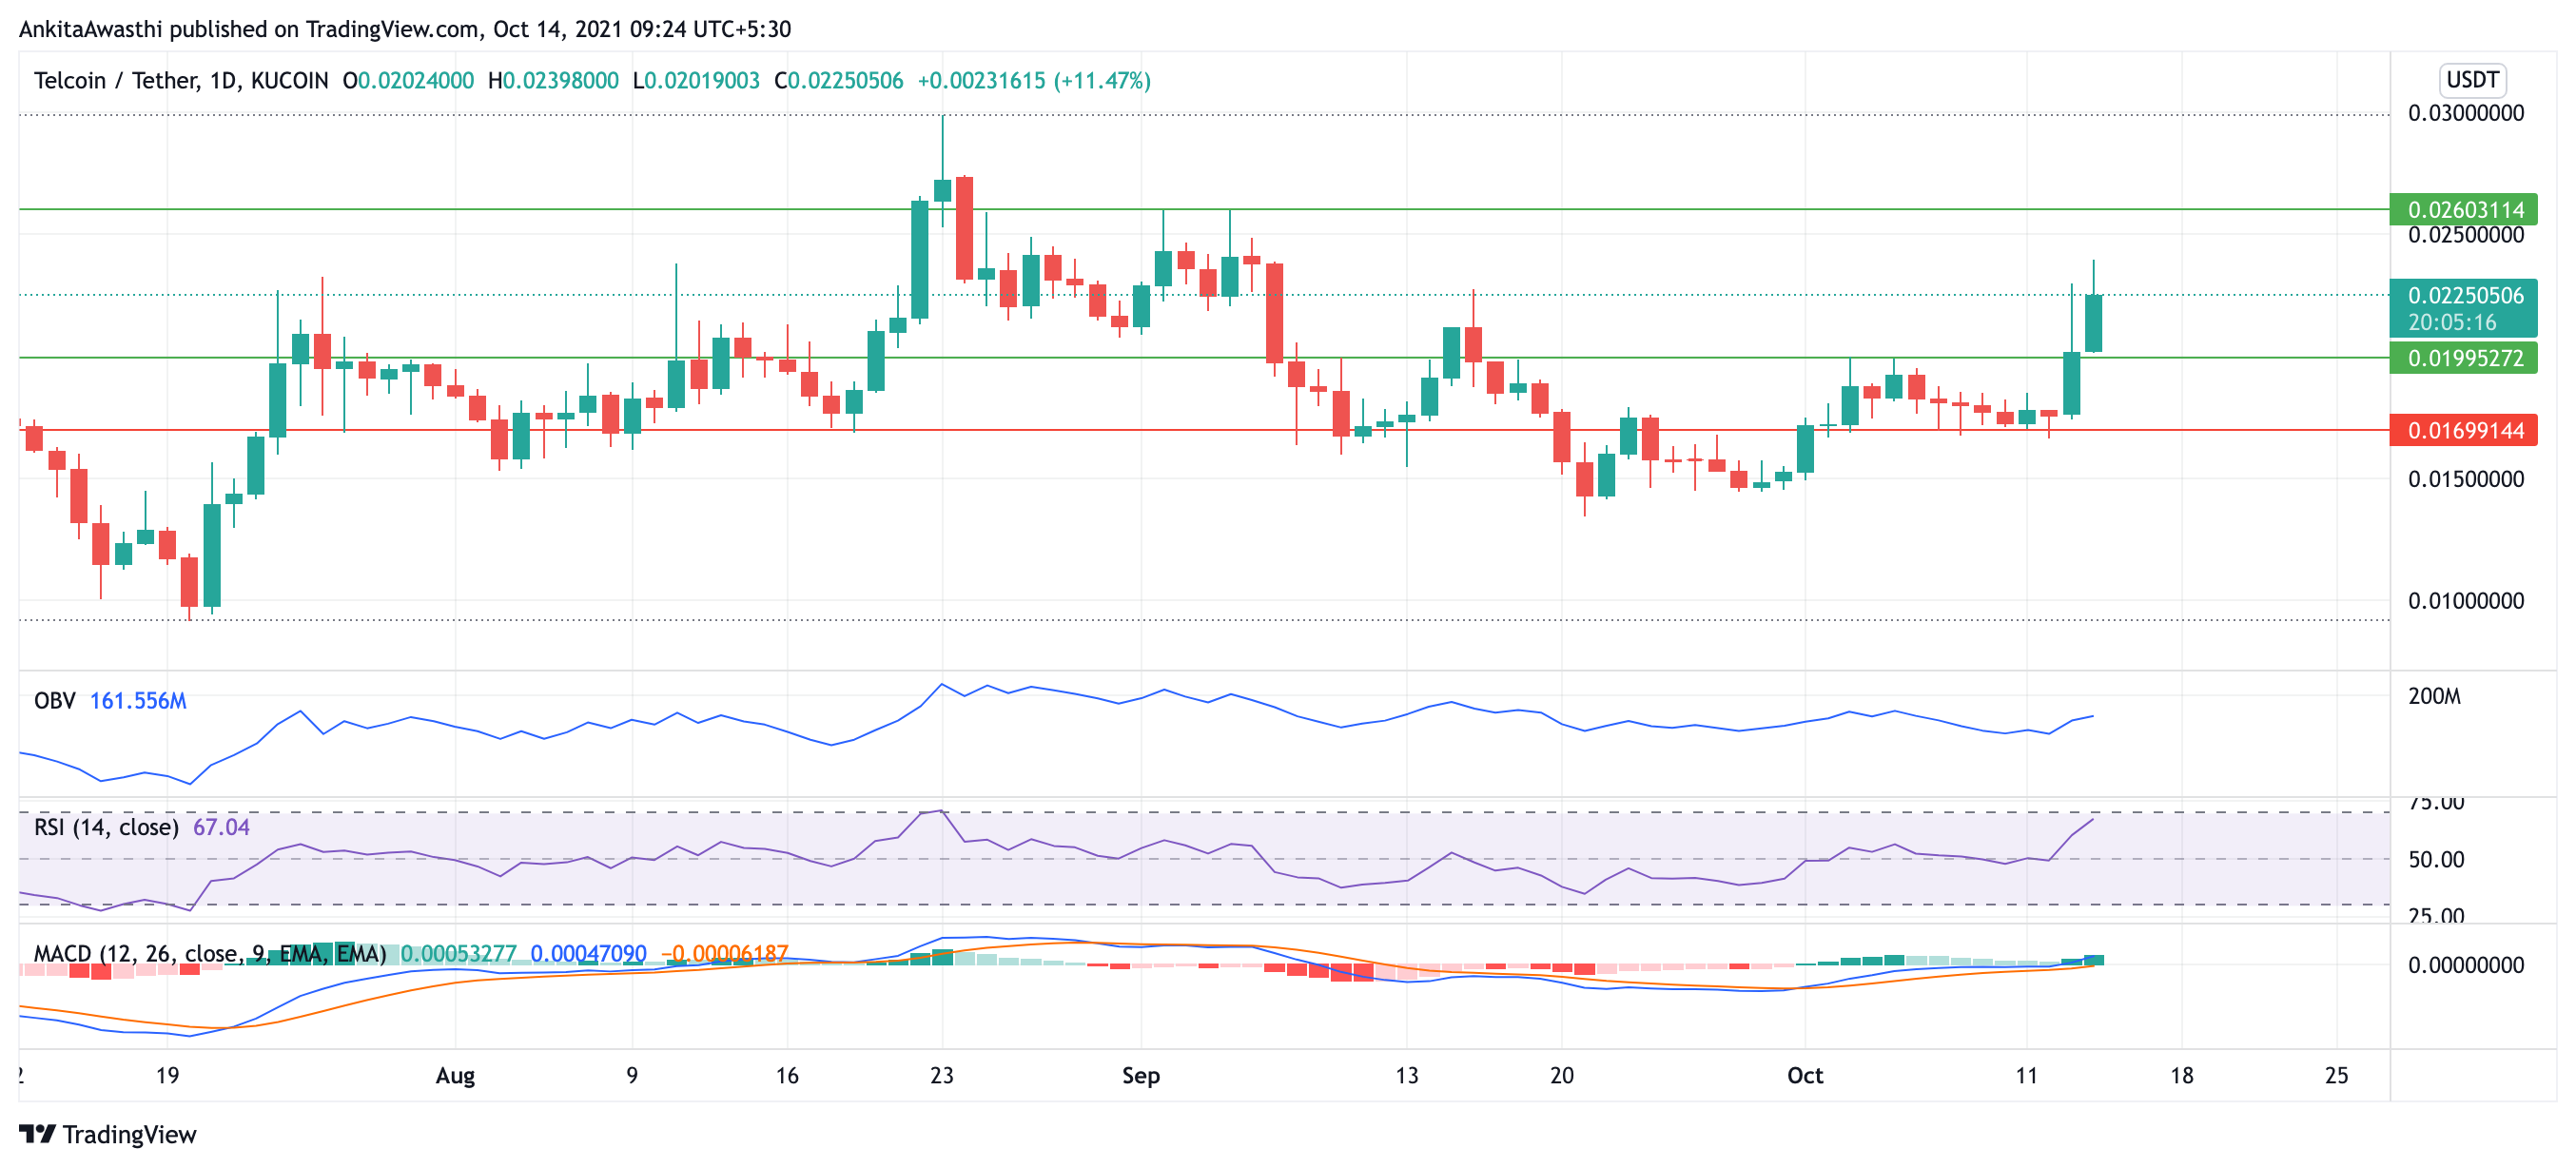
The price dropped gradually till it took support at $0.016. After that, the trend reversed itself and a strong uptrend can be seen. It has broken the previous resistance at the $0.019 level.
The current trading price of TEL is $0.022, which is 11.3% higher than yesterday’s close, This is a bullish signal meaning that the uptrend is likely to continue.
OBV is showing a valley in its trend. This is because of the previous week’s trajectory of the price chart. Currently, the buying pressure is significantly dominating the selling pressure, which is a bullish signal. Traders may take a long position.
RSI witnessed a steep incline in its trend. Currently, it is at 67.51%, which is a bullish signal. Hence, the traders may take a long position here. However, a trend reversal may be seen if RSI enters the overbought region, i.e., if it increases more than the 70% mark.
MACD is showing a bullish signal as well. This is because the fast line moving above the slow line and both the lines are heading in the positive region. There is no divergence of MACD from the price chart.
Day-Ahead and Tomorrow
Fib retracement shows that the price chart has crossed both the $0.0184 and $0.02 levels. This is again a strong bullish signal.
Thus, traders may take a long position here as the indicators are more on the bullish side. They can keep the target at $0.026 while keeping the stop loss at $0.0199.