Bitcoin (BTC) has reached the $57,200 resistance area.
Ethereum (ETH) is trying to break out from the $3,630 resistance area.
XRP (XRP) is trading above a confluence of support levels.
Monero (XMR) has broken out from a descending resistance line.
Curve DAO Token (CRV) is trading inside an ascending parallel channel.
Waves (WAVES) has reclaimed the $27 resistance area.
Fantom (FTM) is in the process of creating a double top pattern.
BTC
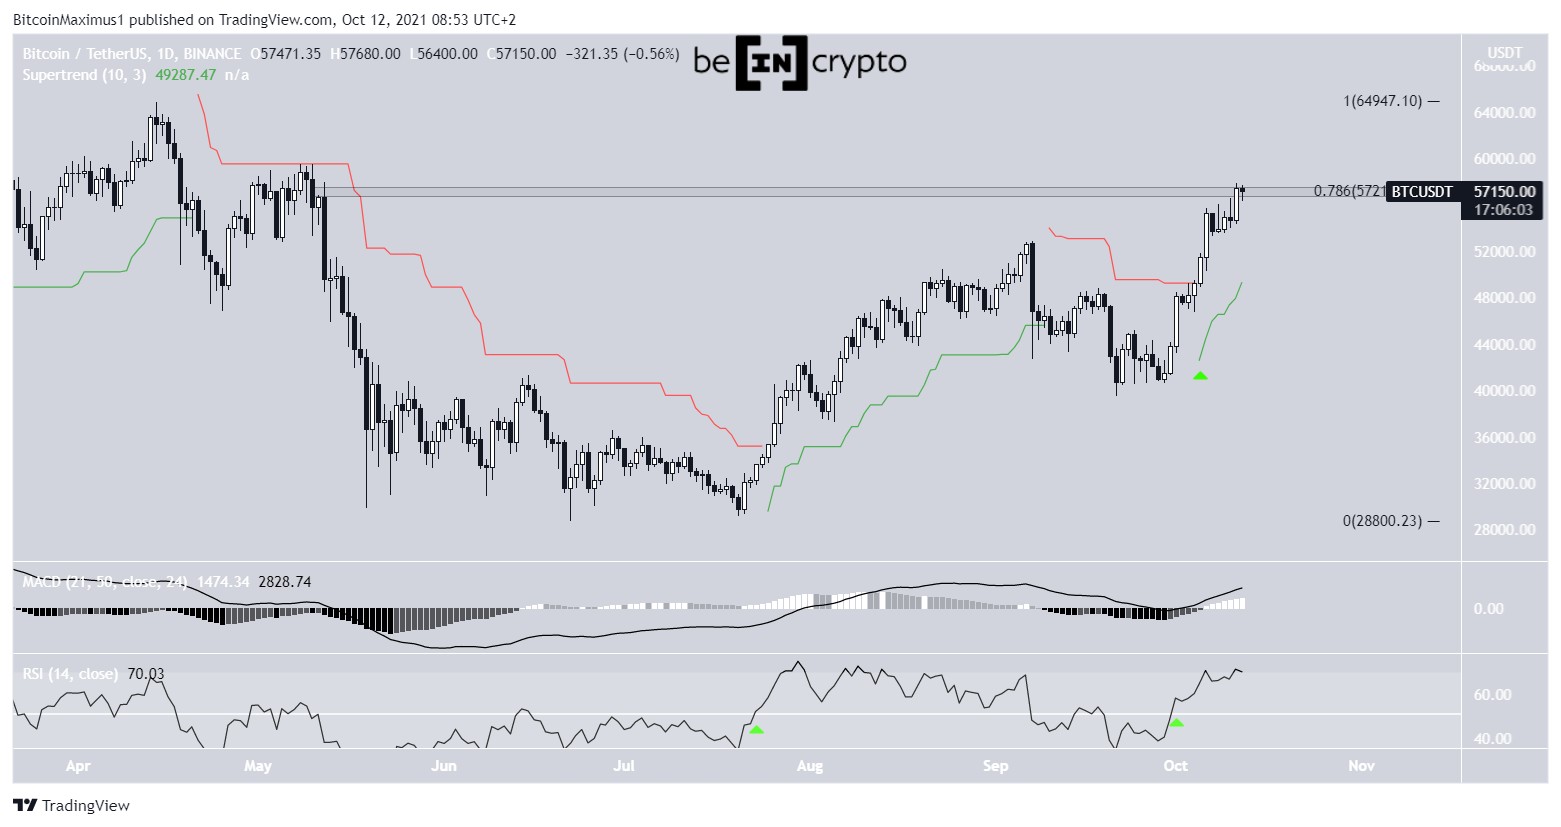
BTC resumed its ongoing ascent on Oct 11 with a large bullish candlestick. The increase took it to the $57,200 resistance area, which is also the 0.786 Fib retracement resistance level. It is worth noting that this is the final resistance area before BTC can reach a new all-time high.
Technical indicators provide a bullish outlook. The RSI has moved above 50 (green icon). The RSI is a momentum indicator, and whether it is above or below 50 can be used as a determinant for the direction of the trend.
Similarly, the MACD is in positive territory and moving upwards. This means that the short-term trend is moving faster than the long-term trend.
Finally, the Supertrend, an indicator that uses volatility to determine the trend is also bullish (green icon).
Therefore, despite the BTC price being right at resistance, all signs point to a bullish trend.
ETH
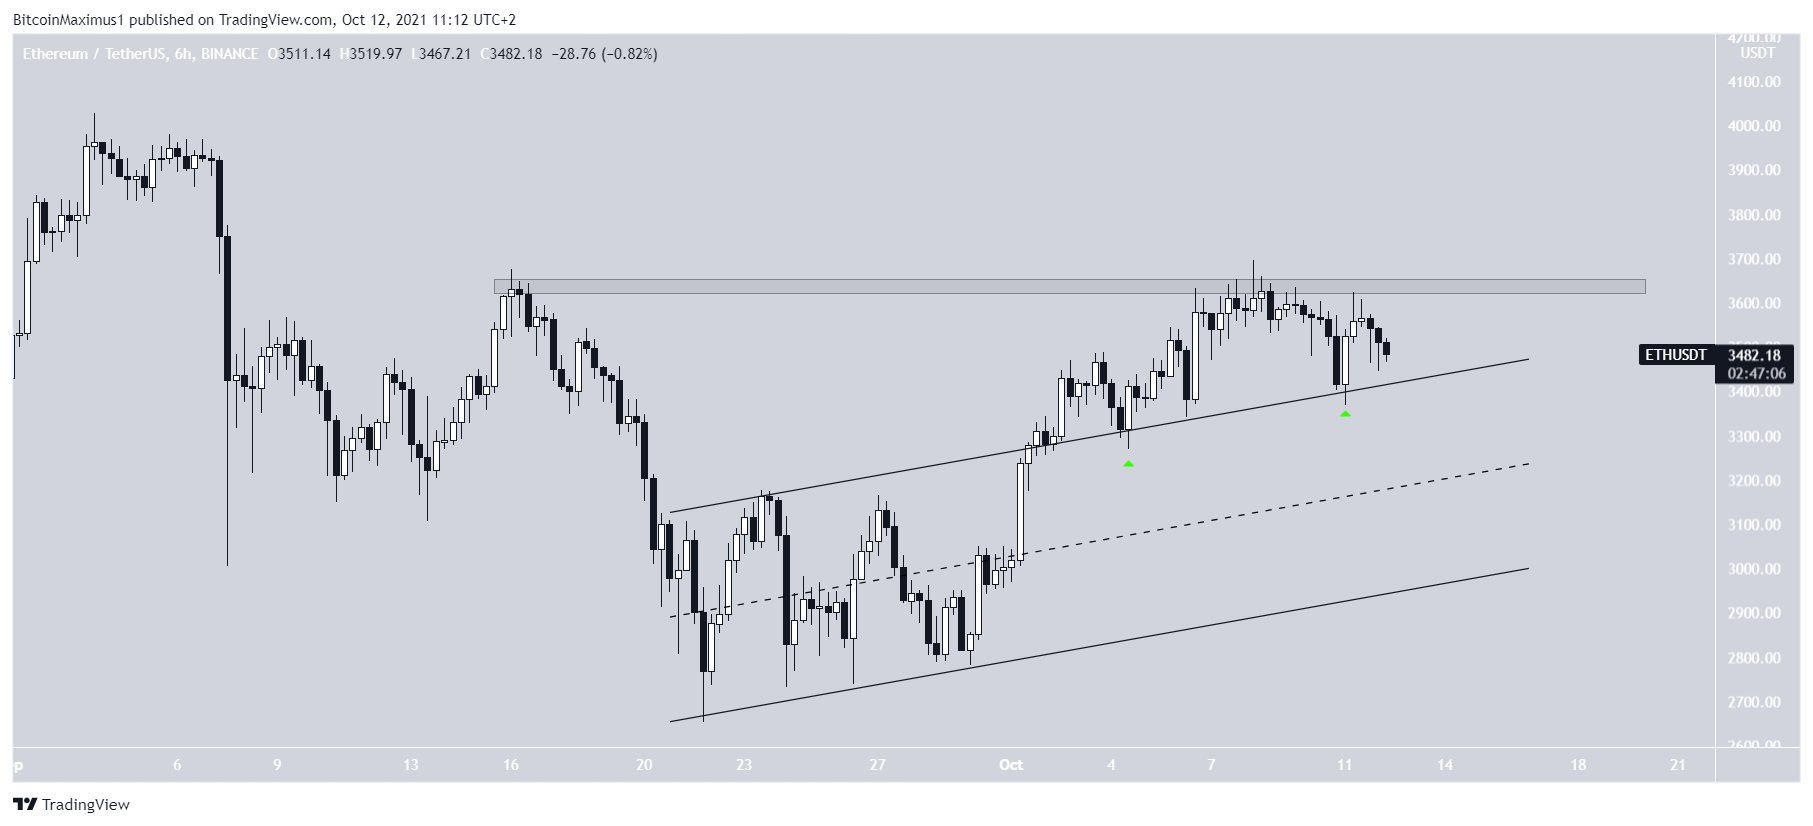
On Oct 1, ETH broke out from an ascending parallel channel and validated it as support after (green icon). Since such channels usually contain corrective movements, the breakout above is a sign that the trend is impulsive. This means that the previous correction is complete and ETH has begun a new upward move.
After being rejected by the $3,630 resistance area, ETH retested the resistance line once more (green icon). Since the resistance line is now acting as support, it can be used to measure the rate of increase. As long as ETH is trading above this support, a breakout above the $3,630 area is likely.
The long-term movement also supports a retest of the September highs.
XRP
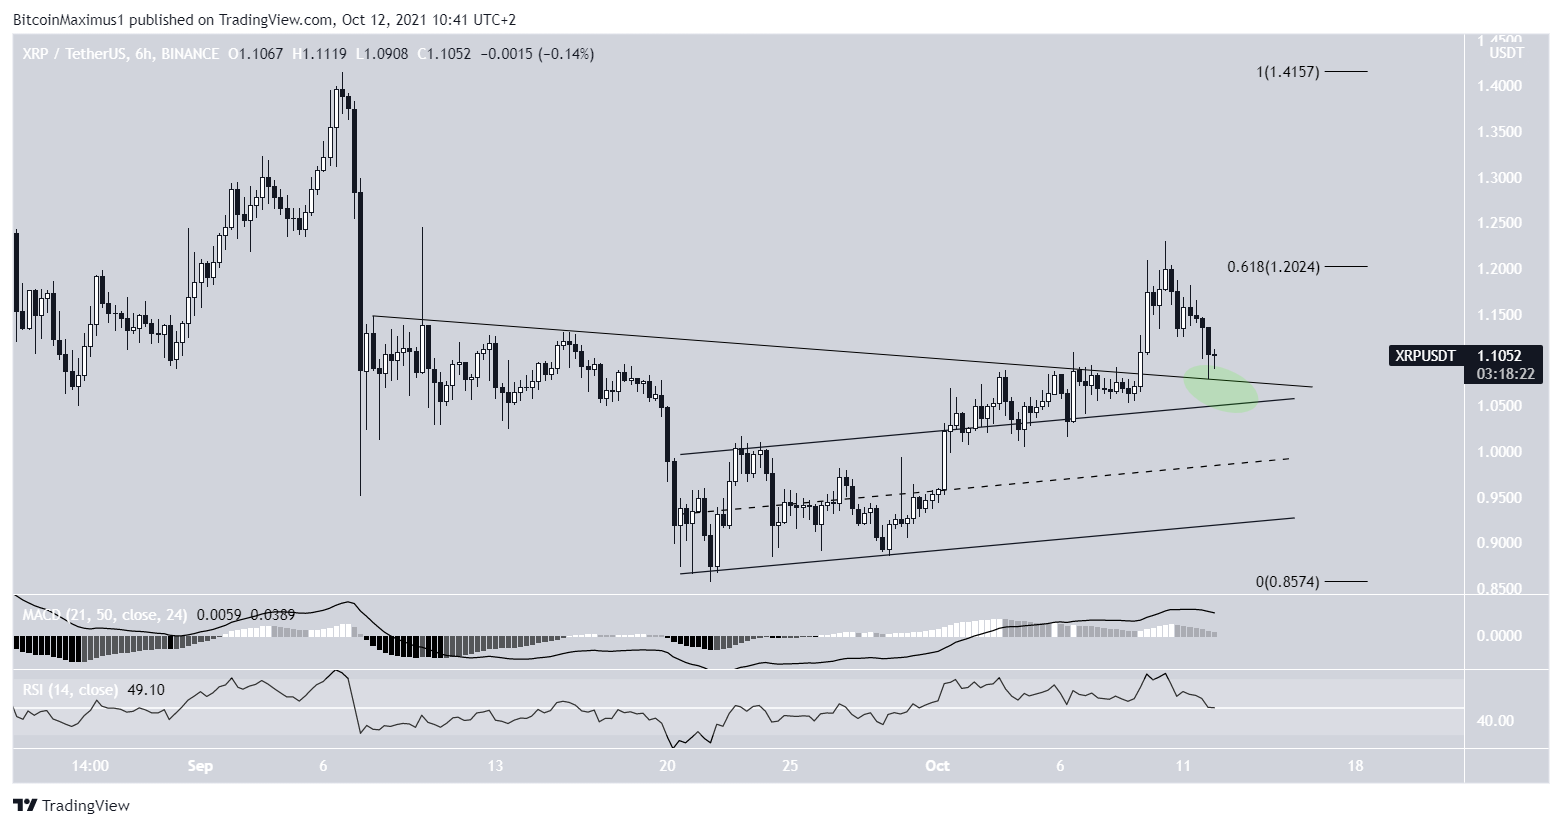
On Oct 9, XRP broke out from a descending resistance line, indicating that the previous decrease has come to an end.
However, it was promptly rejected by the 0.618 Fib retracement resistance level at $1.20. This is a common level for bounces to complete.
Currently, XRP is trading at a confluence of support levels, created by the previous descending resistance line and the resistance line of a parallel channel (green circle). Since both these lines previously acted as resistance, they are now expected to act as support.
Indicators still fail to confirm a bullish reversal.
XMR
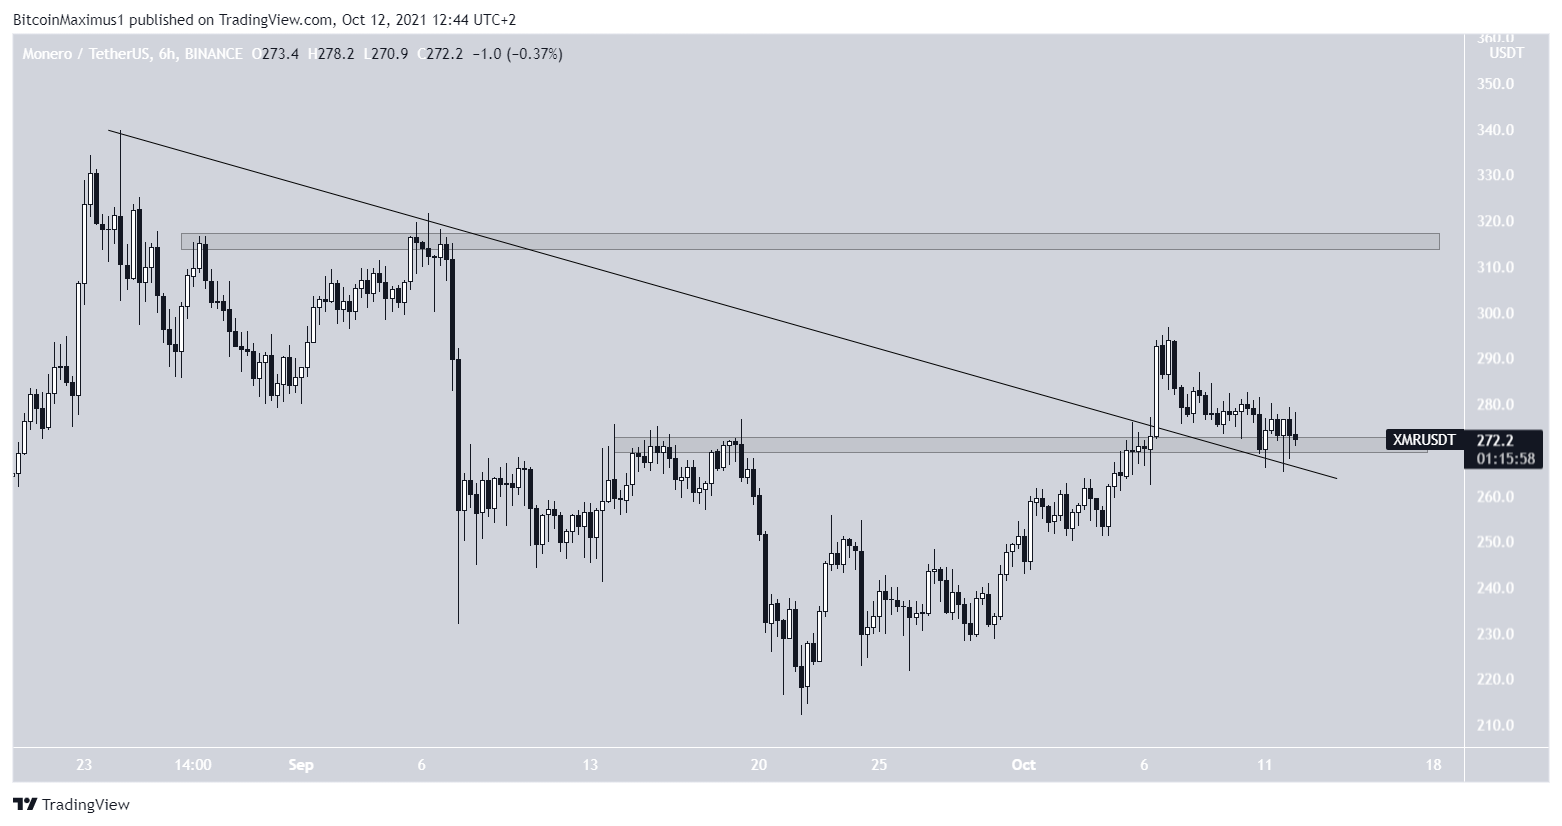
XMR had been following a descending resistance line since Aug 24 after it reached a high of $340.
It reversed the trend on Sept 21 and has been moving upwards since. On Oct 6, it broke out from the resistance line, indicating that the previous downward trend had finished.
The breakout was especially important since it also reclaimed the $270 horizontal area.
Currently, XMR is in the process of validating both these levels as support, a relatively common occurrence after a breakout.
The next closest resistance area is found at $315.
CRV
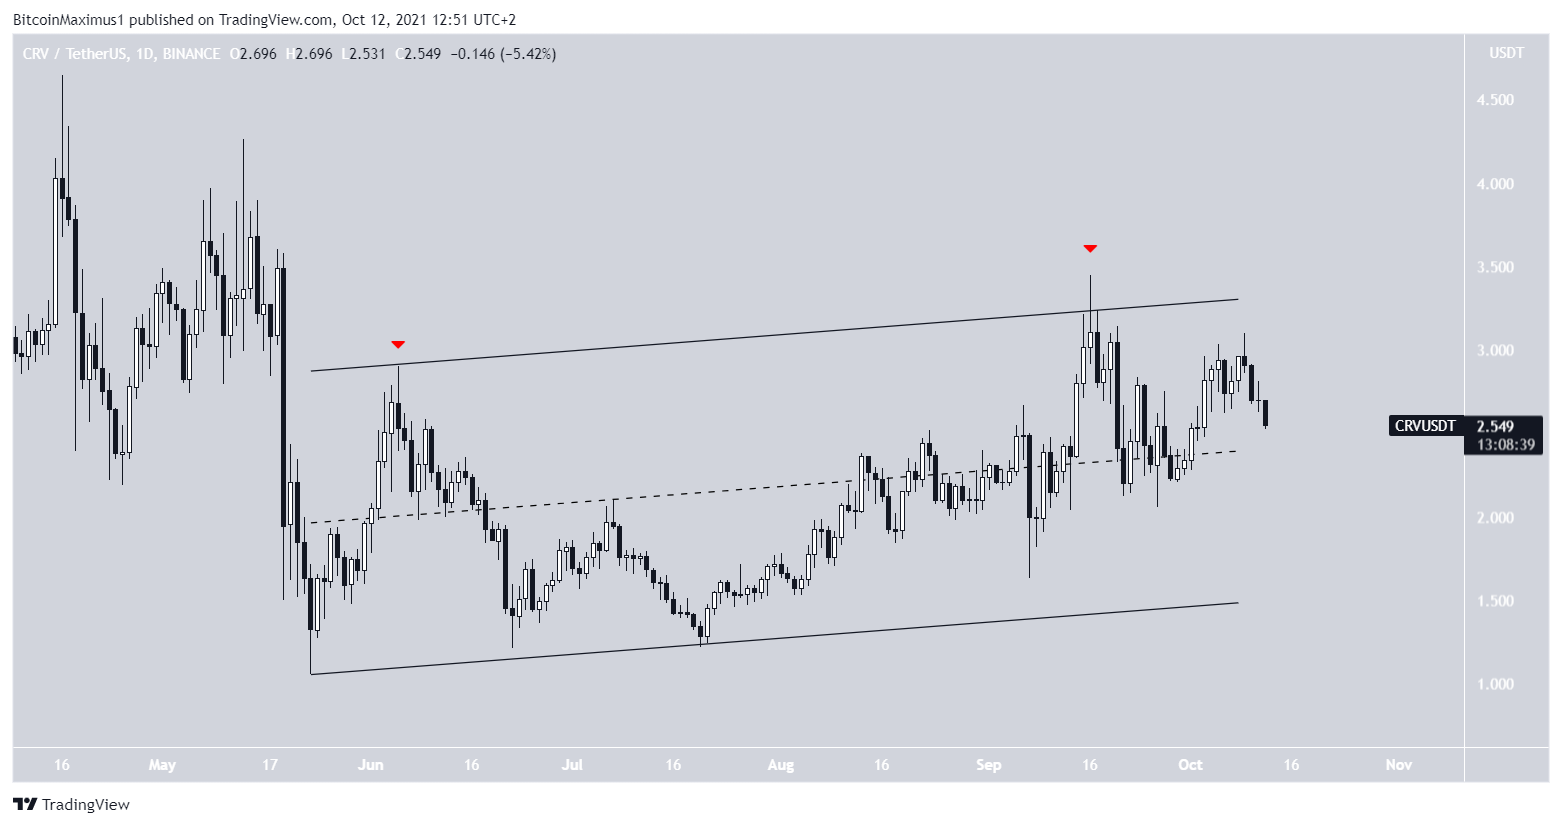
CRV has been moving upwards since May 23. The upward movement has been contained inside an ascending parallel channel. The resistance line of this channel has twice rejected the price (red icons), most recently on Sept 16.
This is a bearish development, especially considering that parallel channels usually contain corrective movements. This means that the entire upward move is still a correction since the dominant trend is downwards.
Unless CRV manages to break out from the channel, the trend is likely to remain bearish.
WAVES
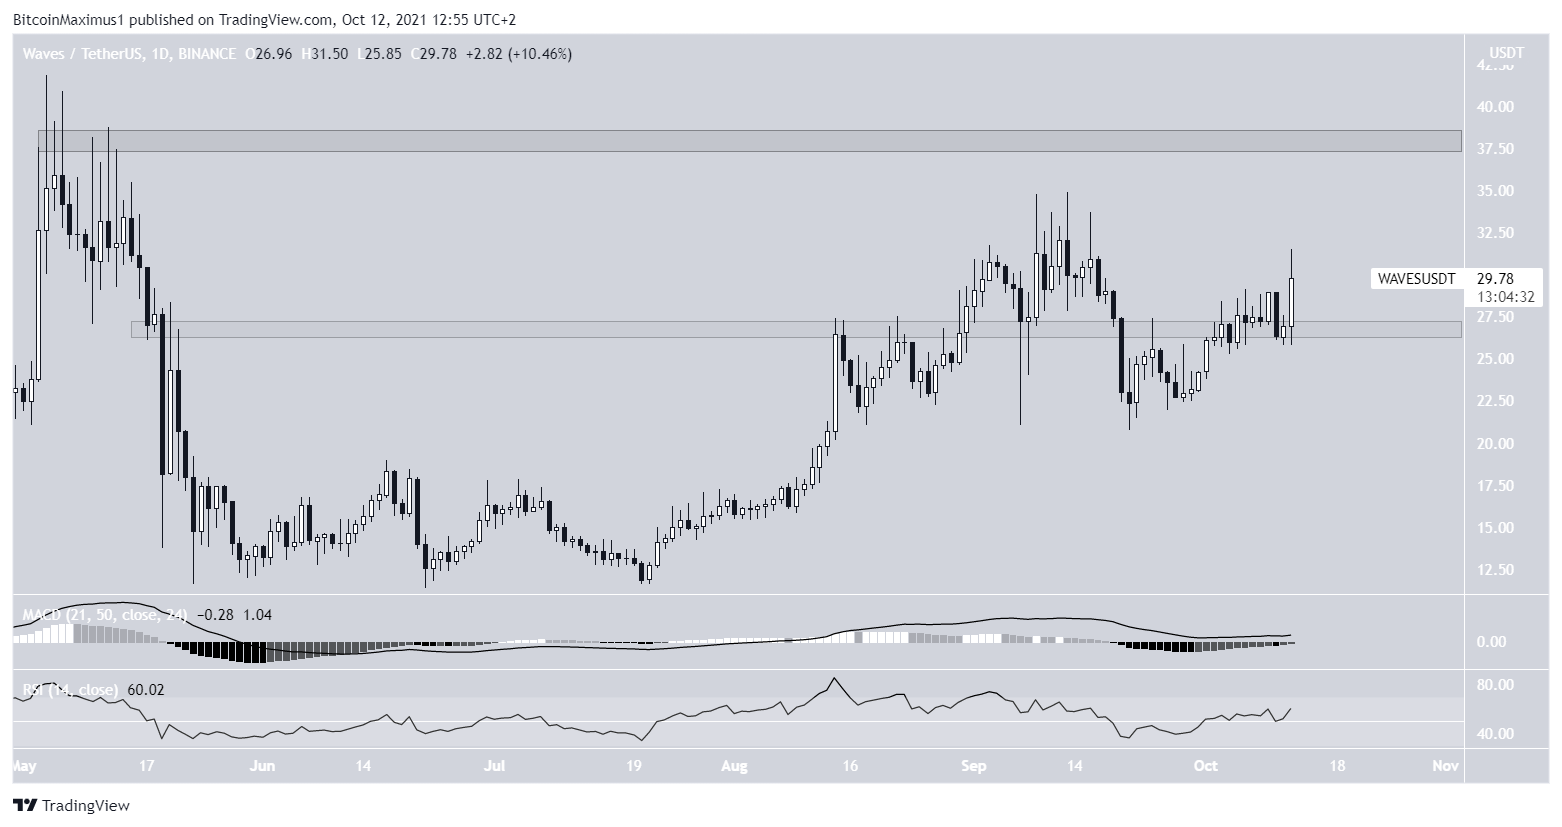
On Oct 9, WAVES retested the $27 level, validating it as support. This movement was crucial since it had previously deviated below the area. On Oct 12, WAVES initiated another upward move.
Technical indicators are bullish. The RSI is above 50, a sign of a bullish trend. In addition to this, the MACD is positive and increasing, even though its histogram has not yet crossed above 0. This means that at this rate, the short-term trend will very soon surpass the long-term one.
The closest resistance area is found at $38, near the all-time high price.
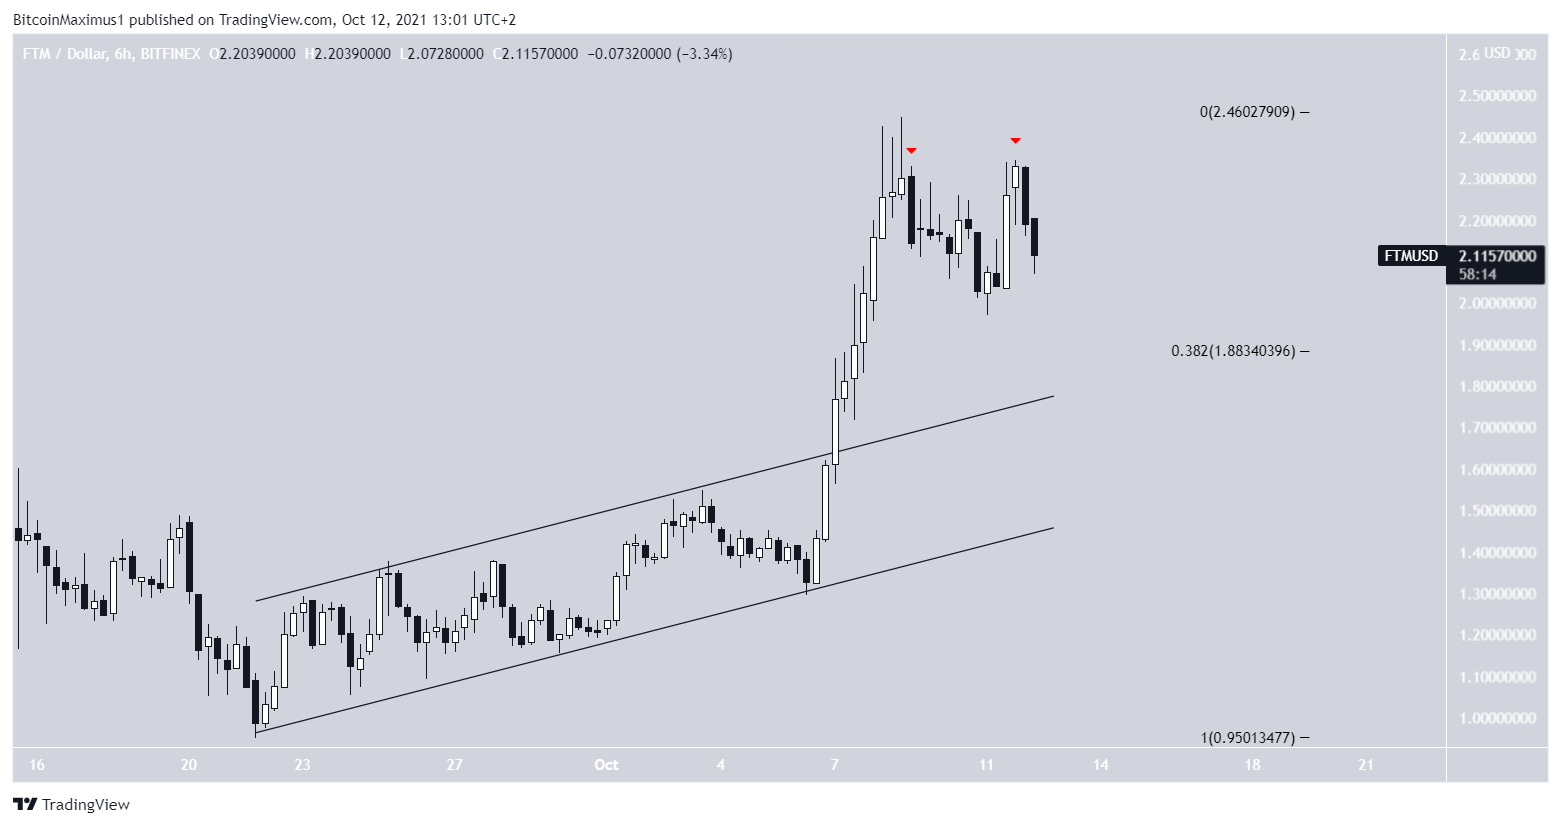
FTM
On Oct 8, FTM reached an all-time high price of $2.45. However, it created a long upper wick and decreased after. The wick is a sign of selling pressure since the higher prices could not be sustained.
On Oct 11, FTM reached the same area but decreased once again. This in turn completed a double top (red icons) pattern. The double top is often considered a bearish pattern that leads to trend reversals.
The closest support area is found at $1.88. This is the 0.382 Fib retracement support level and the resistance line of the parallel channel from which it broke out of.
Therefore, FTM is likely to bounce if it returns to that level.