Founded back in 2017 by ex-Coinbase and Uber engineer Antonio Juliano, dYdX is a foremost decentralized exchange offering perpetual, margin, & spot trading, as well as borrow/lend pools on Ethereum. Let us look at the technical analysis of dYdX.
Past Performance
The DYDX opened on 5th October 2021 at $23.47. The price increased and then decreased across the week to close at $23.58 on 11th October 2021. The percentage change was about 0.4%.
Source: https://www.tradingview.com/x/E1Oz4GHv/
DYDX Technical Analysis
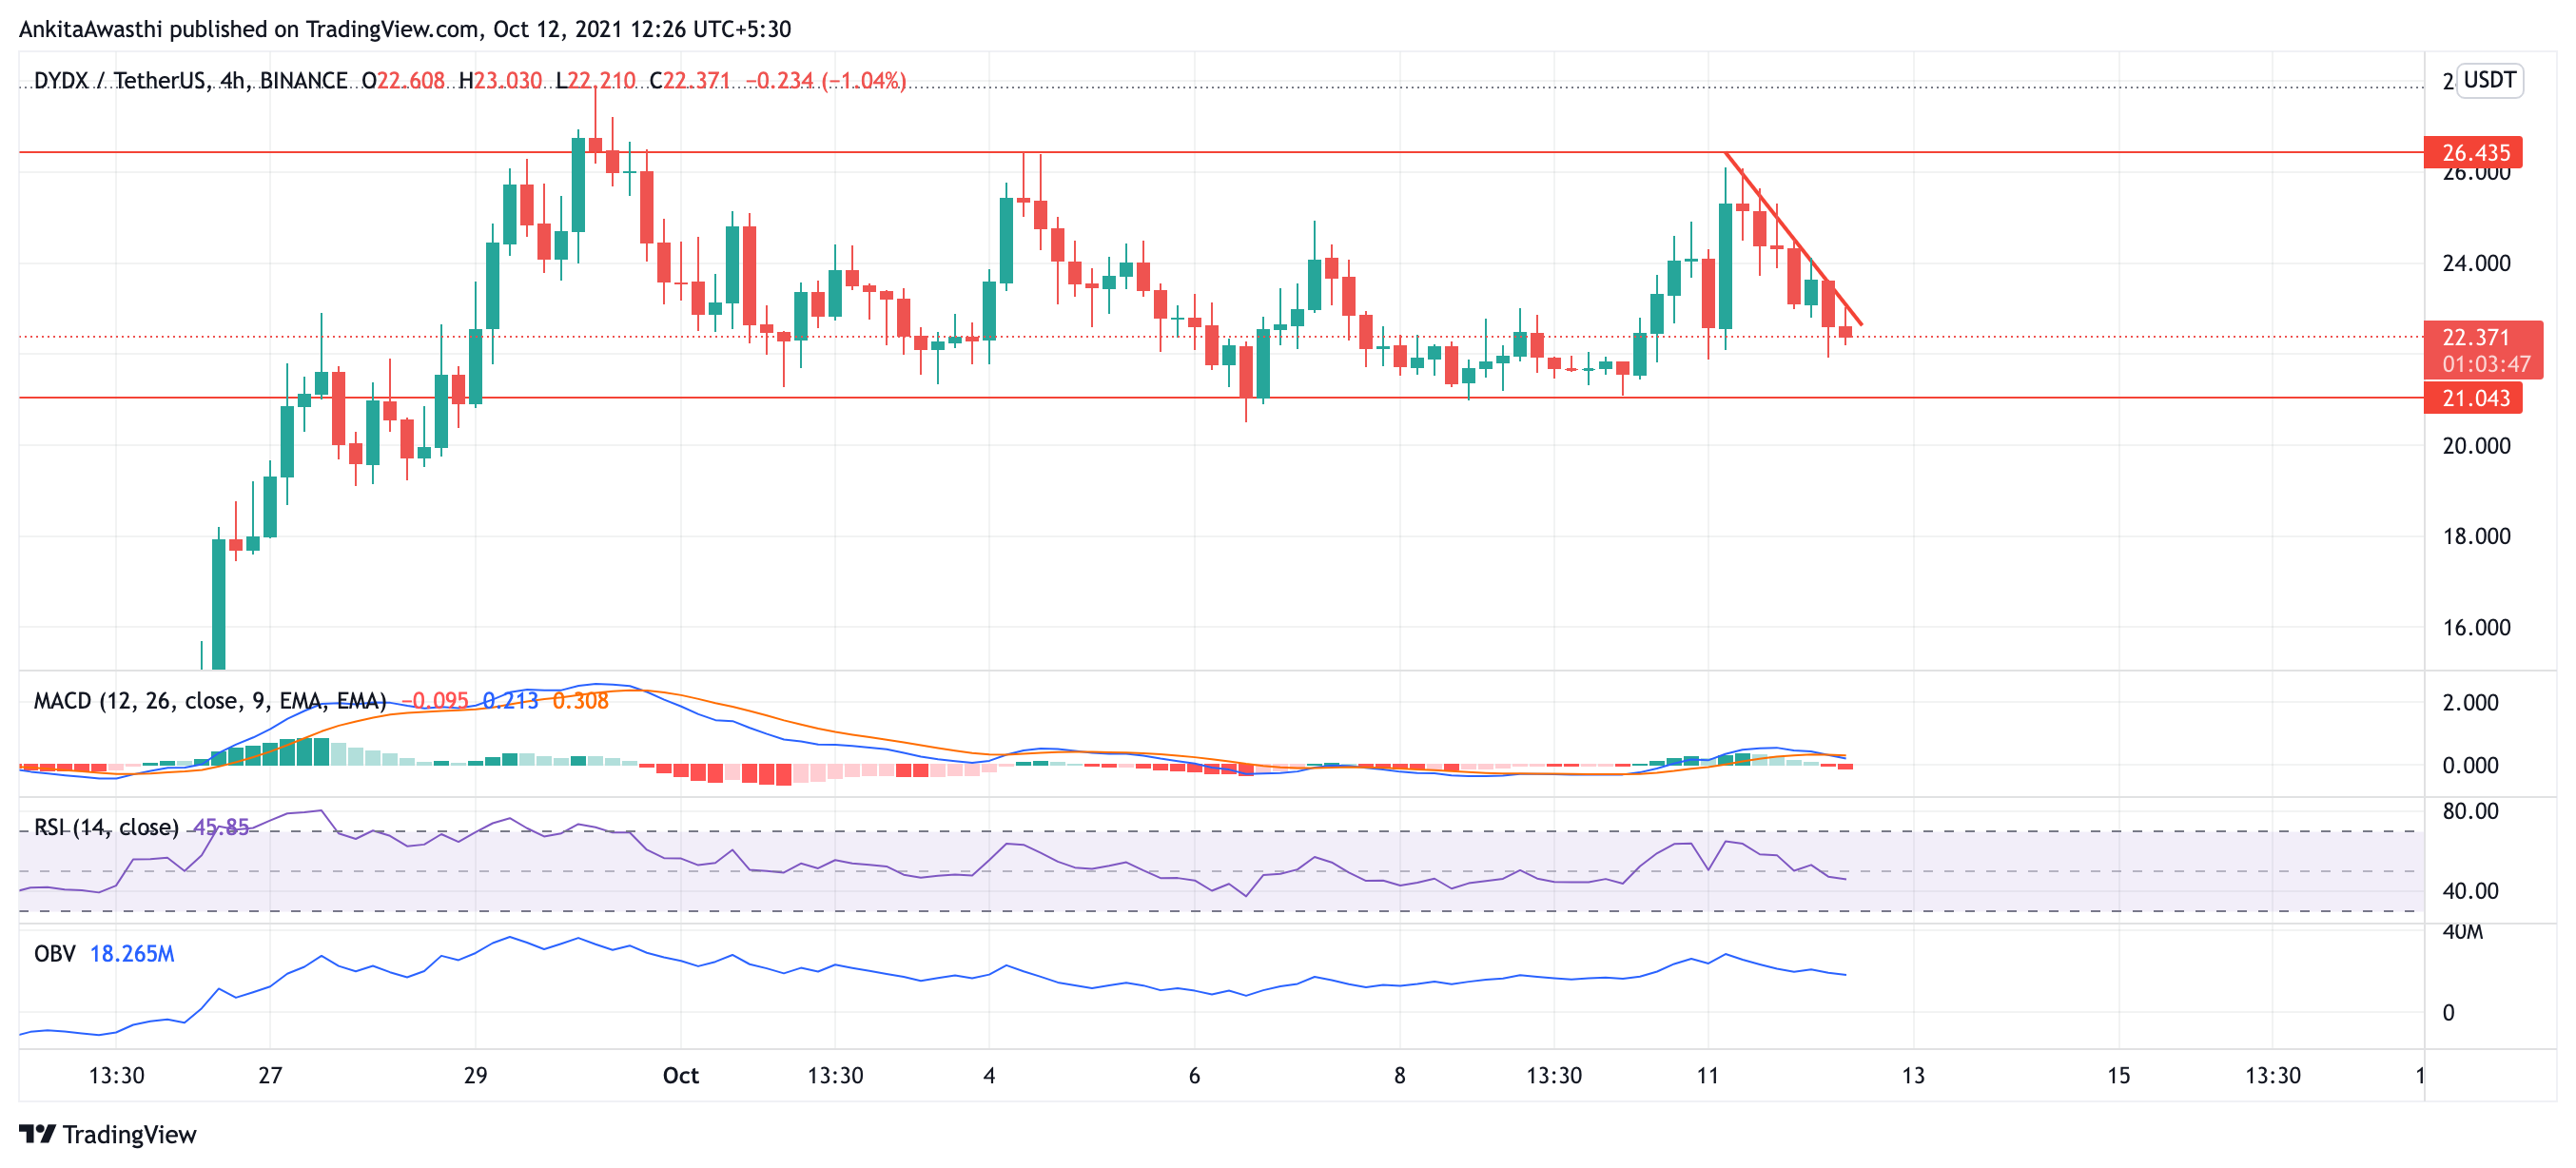
The price increased and then decreased over the past week to form a hill, and the net change in the price was very less.
Currently, dYdX is trading $22.3, which is 5.47% down. The price is on a downtrend right now and is expected to take support at $21.
OBV is showing that the selling pressure is dominating the buying pressure. This means that the downtrend is likely to continue and traders may take a short position.
RSI is currently at 45.84% and is on a downtrend. This is again a bearish signal, showing that dYdX traders may take a short position now.
MACD is showing no divergence from the price chart. The slow line is taking over the fast line, which is a strong selling point. The traders may take a short position at this time.
Day-Ahead and Tomorrow
The chart has crossed the fib level at $22.65. DYDX is now expected to hit the level at $21.71.
Thus, the signals are bearish and traders may take a short position by placing a stop loss at $21. However, a trend reversal can also be seen once the chart hits the support at $21.