Polygon or MATIC is an easy-to-use platform for Ethereum scaling. It was founded in October 2017, by Indian developers Sandeep Nailwal, Jayanti Kanani, and Anurag Arjun. Its major focus is to increase scalability for different cryptos. The platform uses a POS or proof-of-stake consensus to secure the network and create a new currency.
Many developers use the user-friendly Ethereum Virtual Machine to build decentralized apps. With its EVM compatibility, Polygon makes it easier for developers to create decentralized apps and port them. Developers have deployed many Ethereum apps onto Polygon, including SushiSwap and Aave.
Let us look at the technical analysis of MATIC.
Past Performance
Seven days ago, MATIC opened at $1.33 on 4th October 2021. The price remained relatively stable, after which it closed at $1.25 on 10th October 2021. There was an overall change of about -6%.
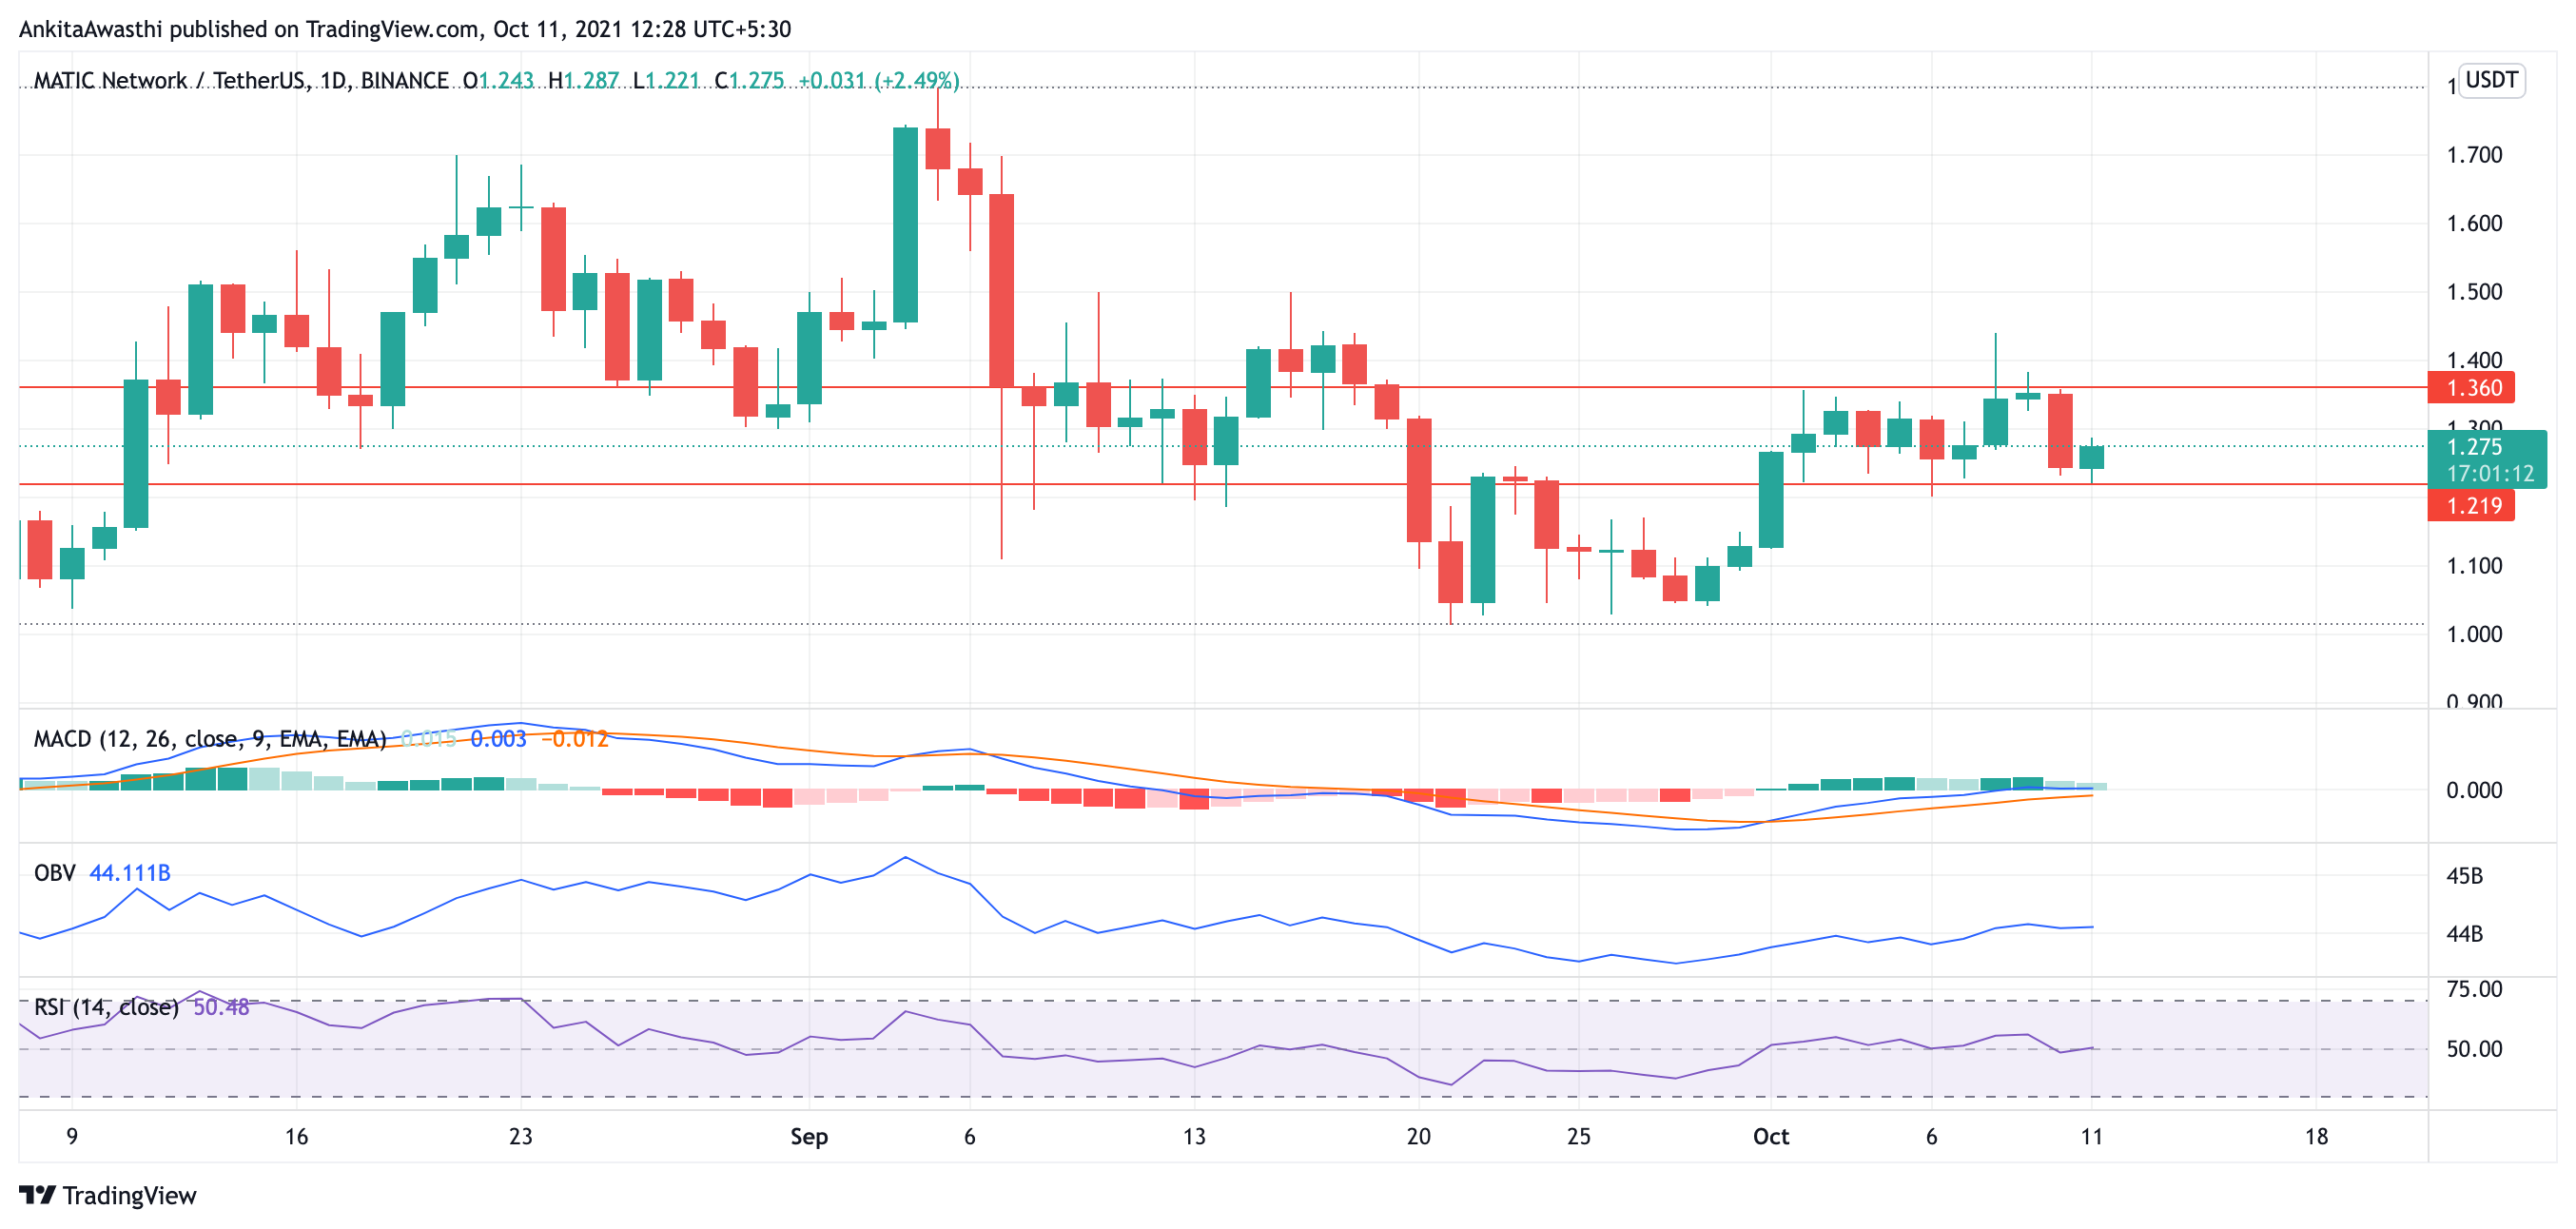
Source: https://www.tradingview.com/x/MpRD6qJr/
MATIC Technical Analysis
The price of MATIC fluctuated very little in the past week. It oscillated primarily between $1.36 and $1.22. The current trading price for MATIC is $1.275, which is about 2.5% up. The price has seemingly entered a box.
OBV is showing that the buying and selling pressures are balanced for the last few days. This indicates that traders may hold their current positions.
RSI is at equilibrium. It is currently at 50.54% which again means that the price is expected to be stable. Traders need to wait for a clear call before taking a long or a short position.
MACD is showing similar signs. Both the lines are approaching each other, and they are heading towards equilibrium. This confirms the last week’s stability. MACD is showing no divergence from the price chart.
Day-Ahead and Tomorrow
Fib numbers are suggesting that the MATIC price is oscillating between the price levels of $1.18 and $1.36.
Thus, the indicators are showing that the MATIC price chart has entered a box. Traders need to hold their current positions until it comes out of the box to show a bearish or a bullish signal.