Ripple’s price has shown bullish movement in recent weeks. However, there is a notable resistance level that needs to be overcome before a more sustained rally can be anticipated.
Technical Analysis
By: Edris
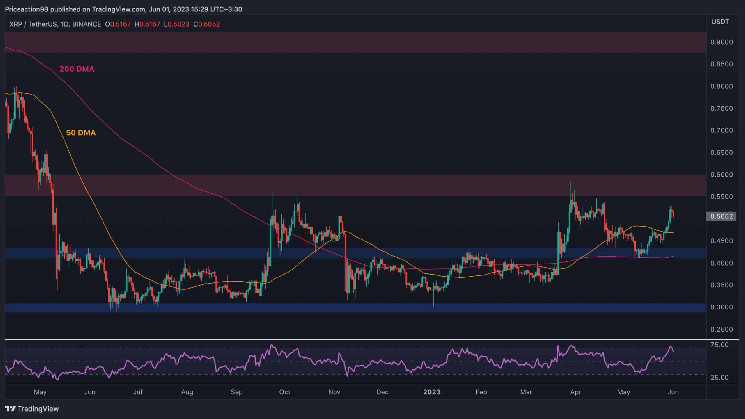
XRP/USDT Daily Chart:
XRP has displayed a consistent upward trend after being rejected from the 200-day moving average of around $0.4. Additionally, it has surpassed the 50-day moving average of around $0.45 and appears to be targeting the resistance zone at $0.6 in the short term.
A successful breakthrough of the $0.6 level would likely initiate a bullish phase, with the price potentially reaching as high as $0.9 in the mid-term. However, it is worth noting that the RSI has recently indicated an overbought condition, suggesting the possibility of a pullback or a period of consolidation in the upcoming days.
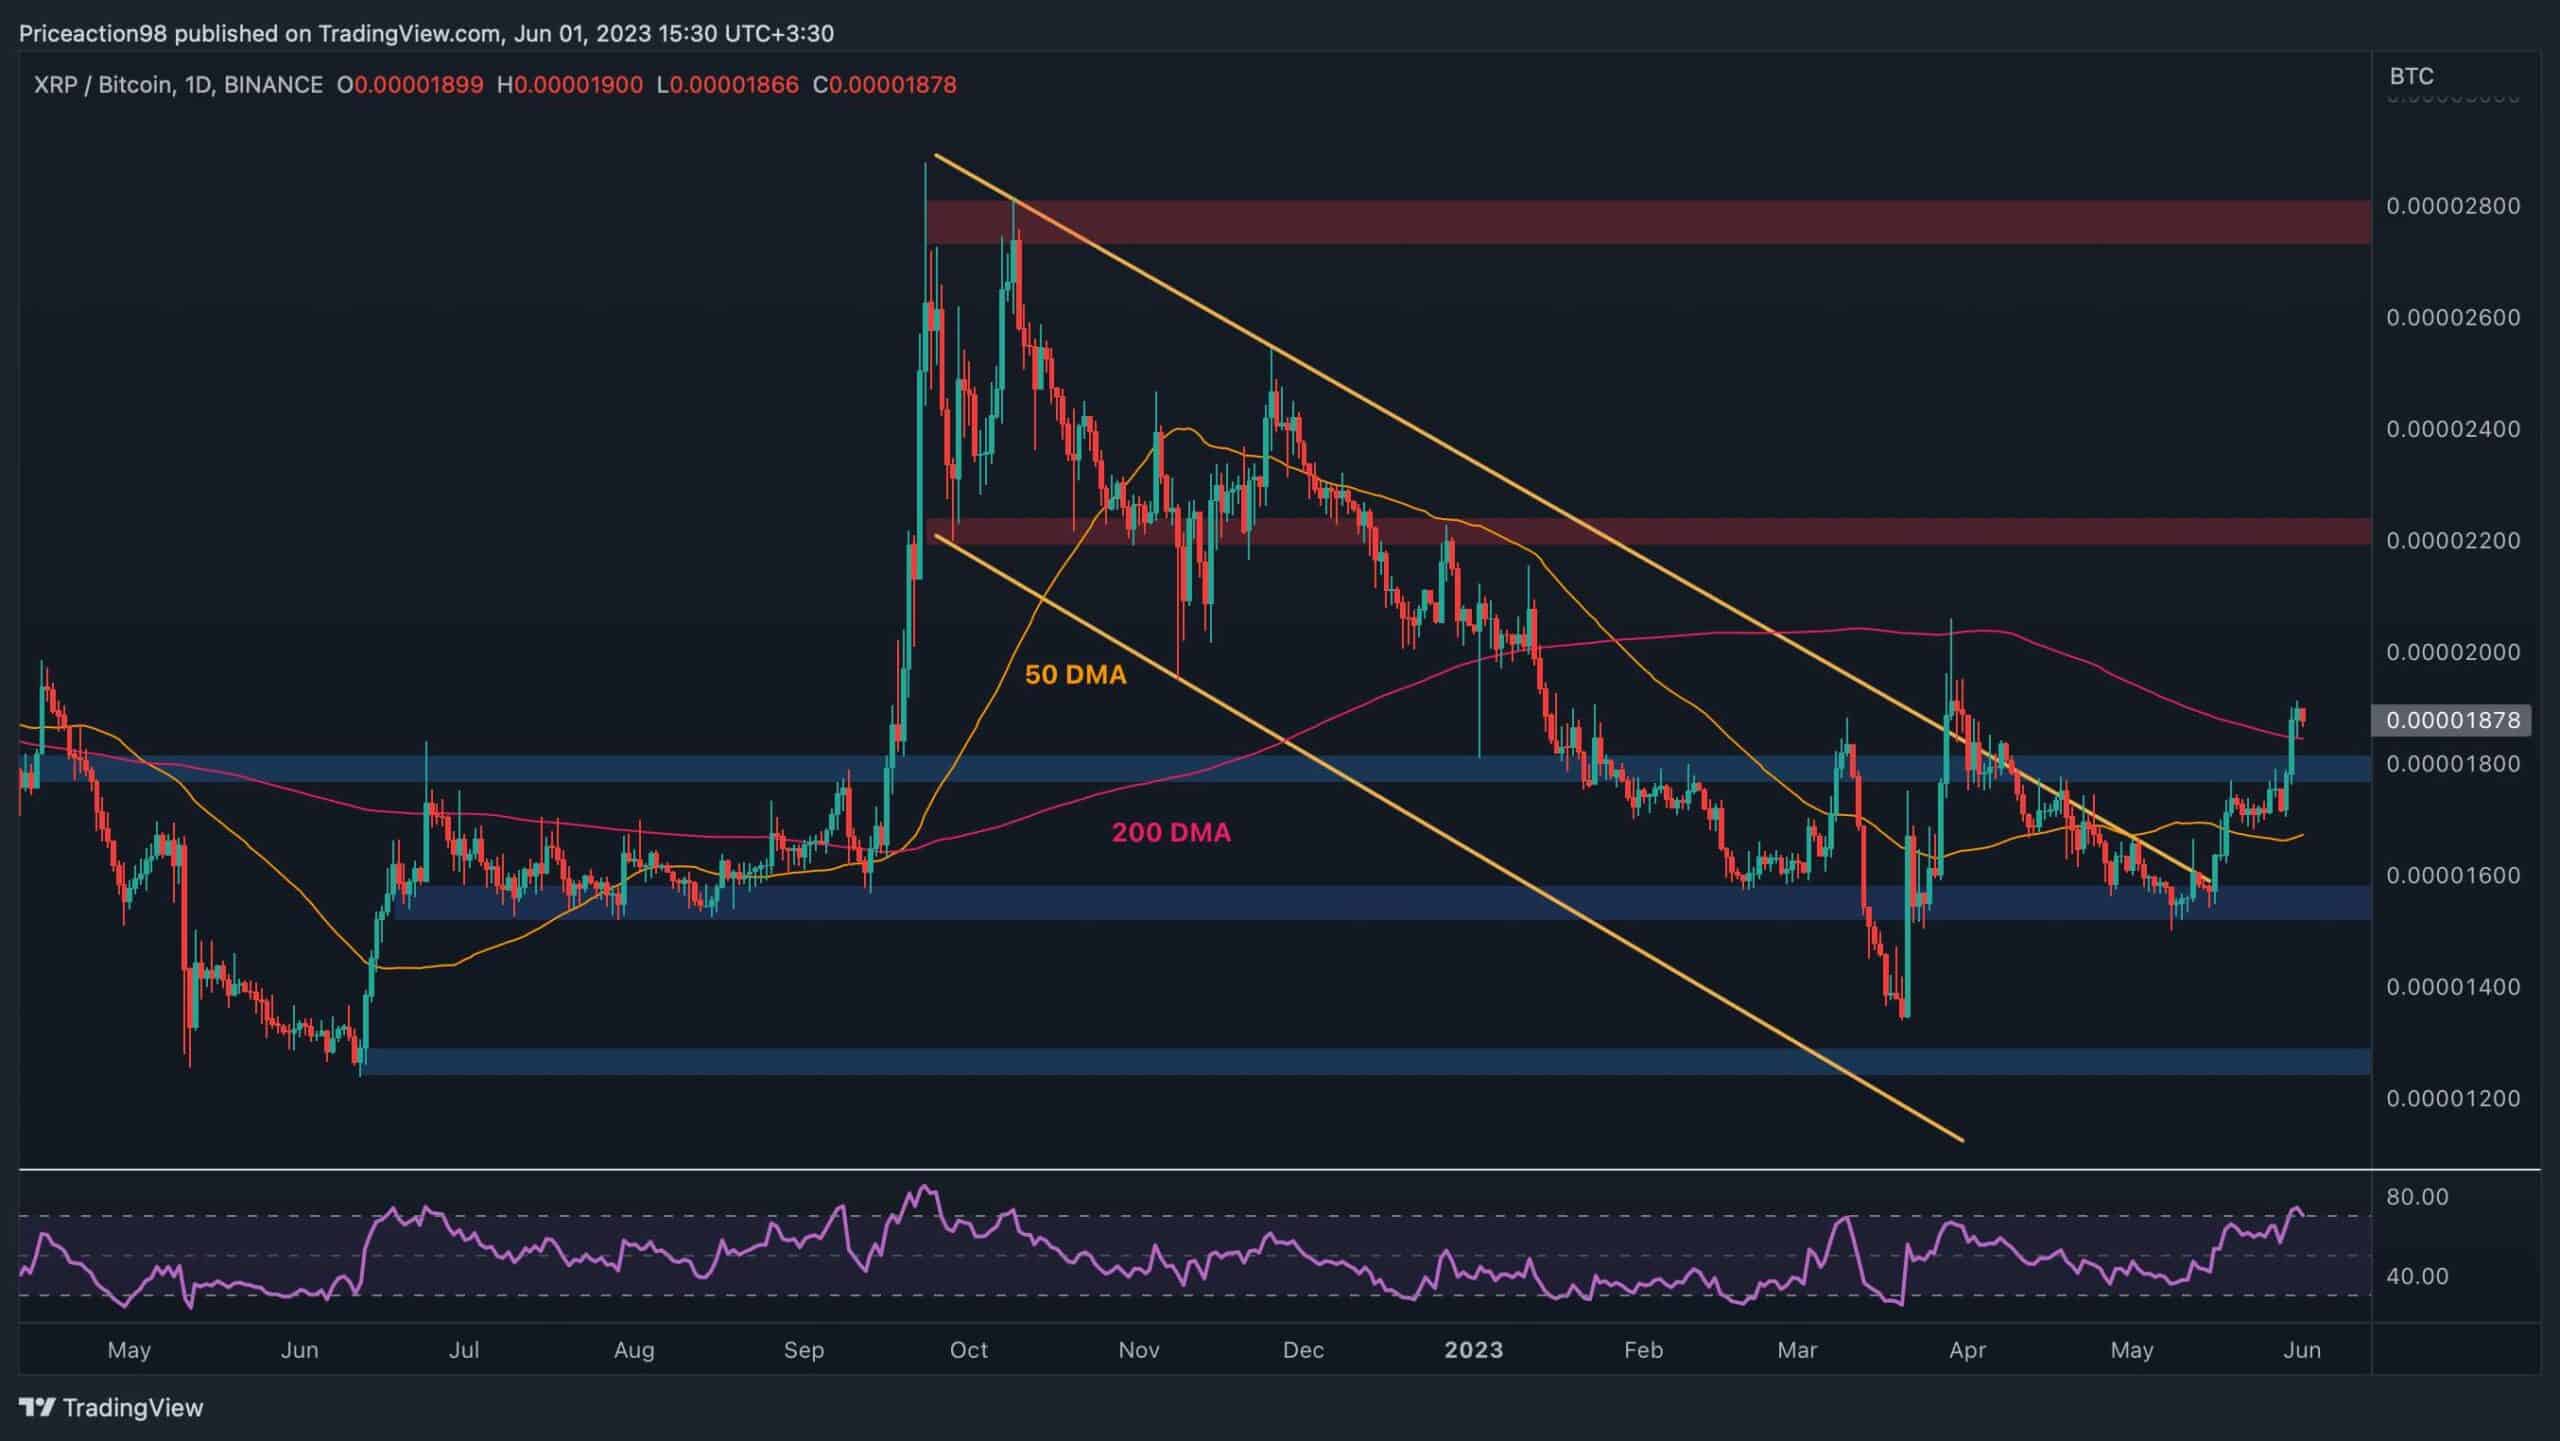
XRP/BTC Daily Chart
The price has successfully broken out of the significant descending channel after finding support near the 0.000016 SAT level. Furthermore, both the 50-day moving average, positioned around 0.000017 SAT, and the static resistance level at 0.000018 SAT have been surpassed.
The price is attempting to breach the 200-day moving average; however, the RSI’s overbought signal suggests the potential for a short-term correction. In such a scenario, both the 0.000018 SAT level and the 50-day moving average are likely to be retested, providing support to the market.