CELO token price is at a crucial support level within a triangle price pattern which can give a bullish breakout.
Celo is aiming to bridge the gap between these two technologies. It also supports the creation of DApps, smart contracts, and other DeFi-related projects.
The Celo blockchain is optimized for mobile and automatically calculates transaction fees. It also allows users to pay gas costs that power currency transactions.
Let us now look at the technical analysis of CELO cryptocurrency.
Past Performance of CELO
The CELO coin price has been moving sideways for more than a week. The price action is ranging between $5.5 and $6.7. If we apply Fibonacci levels, we can observe the price is fluctuating near the 50% pivot level. In addition, the price action is ready to form a morning star pattern in the daily chart. The formation will complete if the price falls below the 50% Fibonacci level.
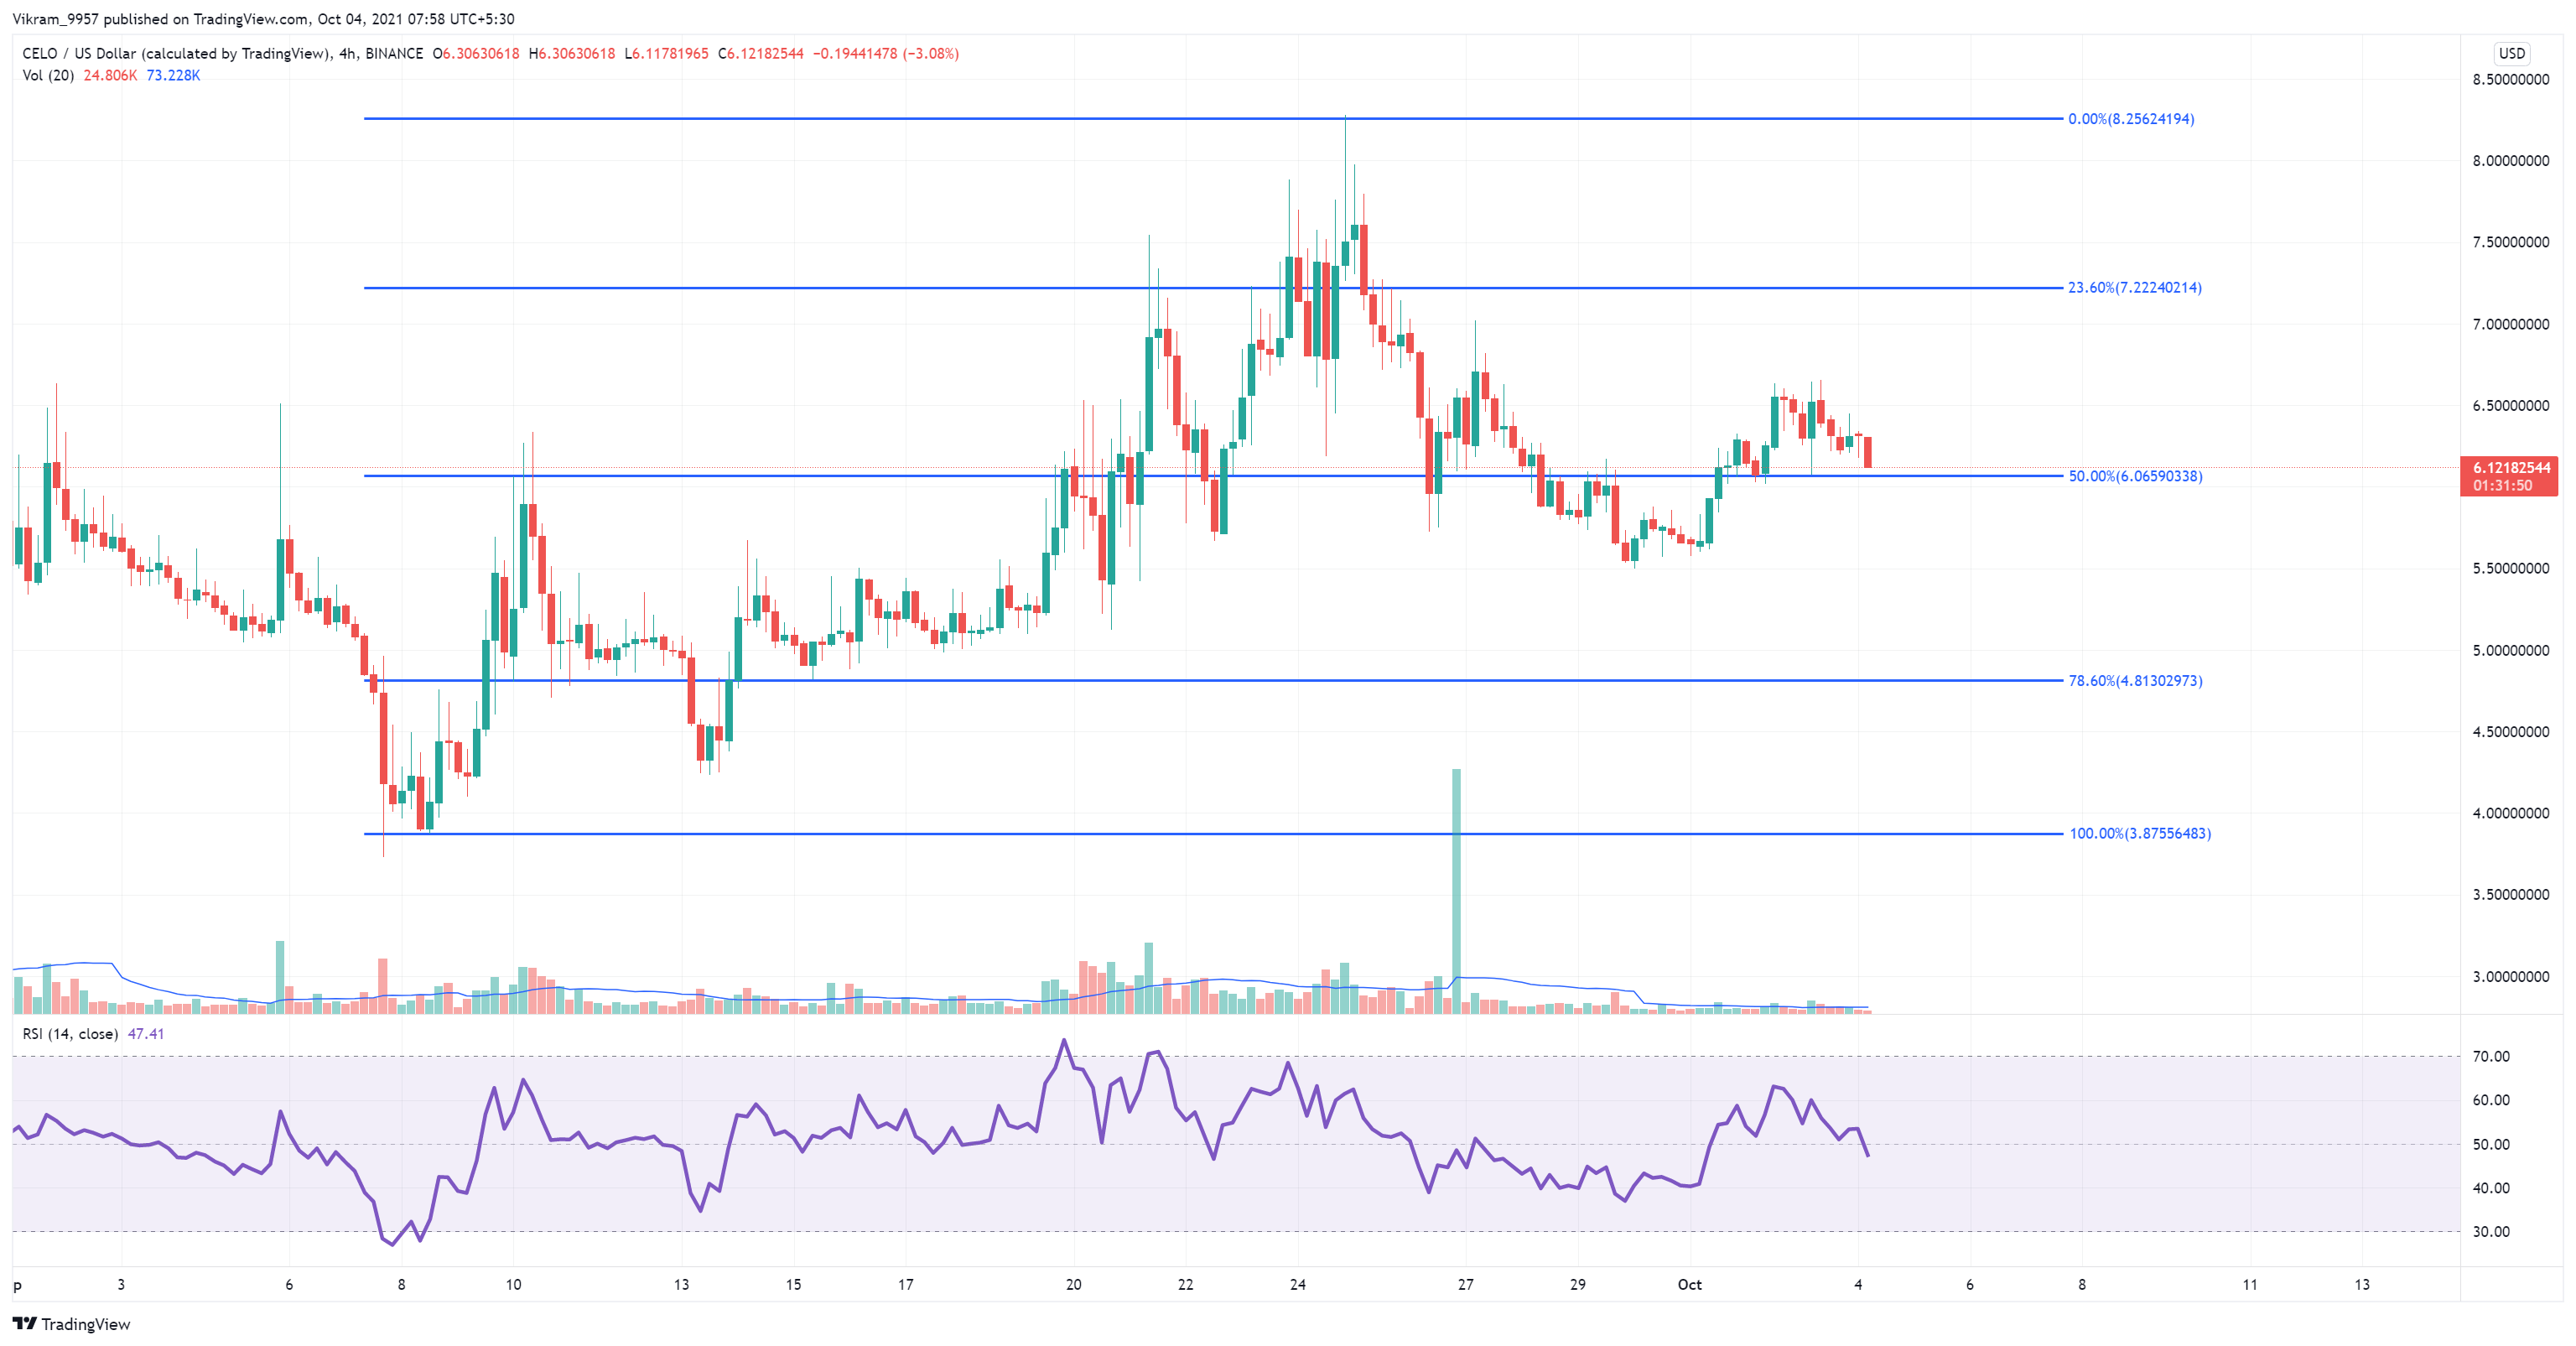
Source - Tradingview
CELO Technical Analysis
At the time of writing, CELO cryptocurrency is at $6.15%. Additionally, it has experienced a fall of 2.96% in the past 24 hours. In addition, the intraday trading volume of the coin fell by 15%, indicating a loss in buyer’s interest.
Source - Tradingview
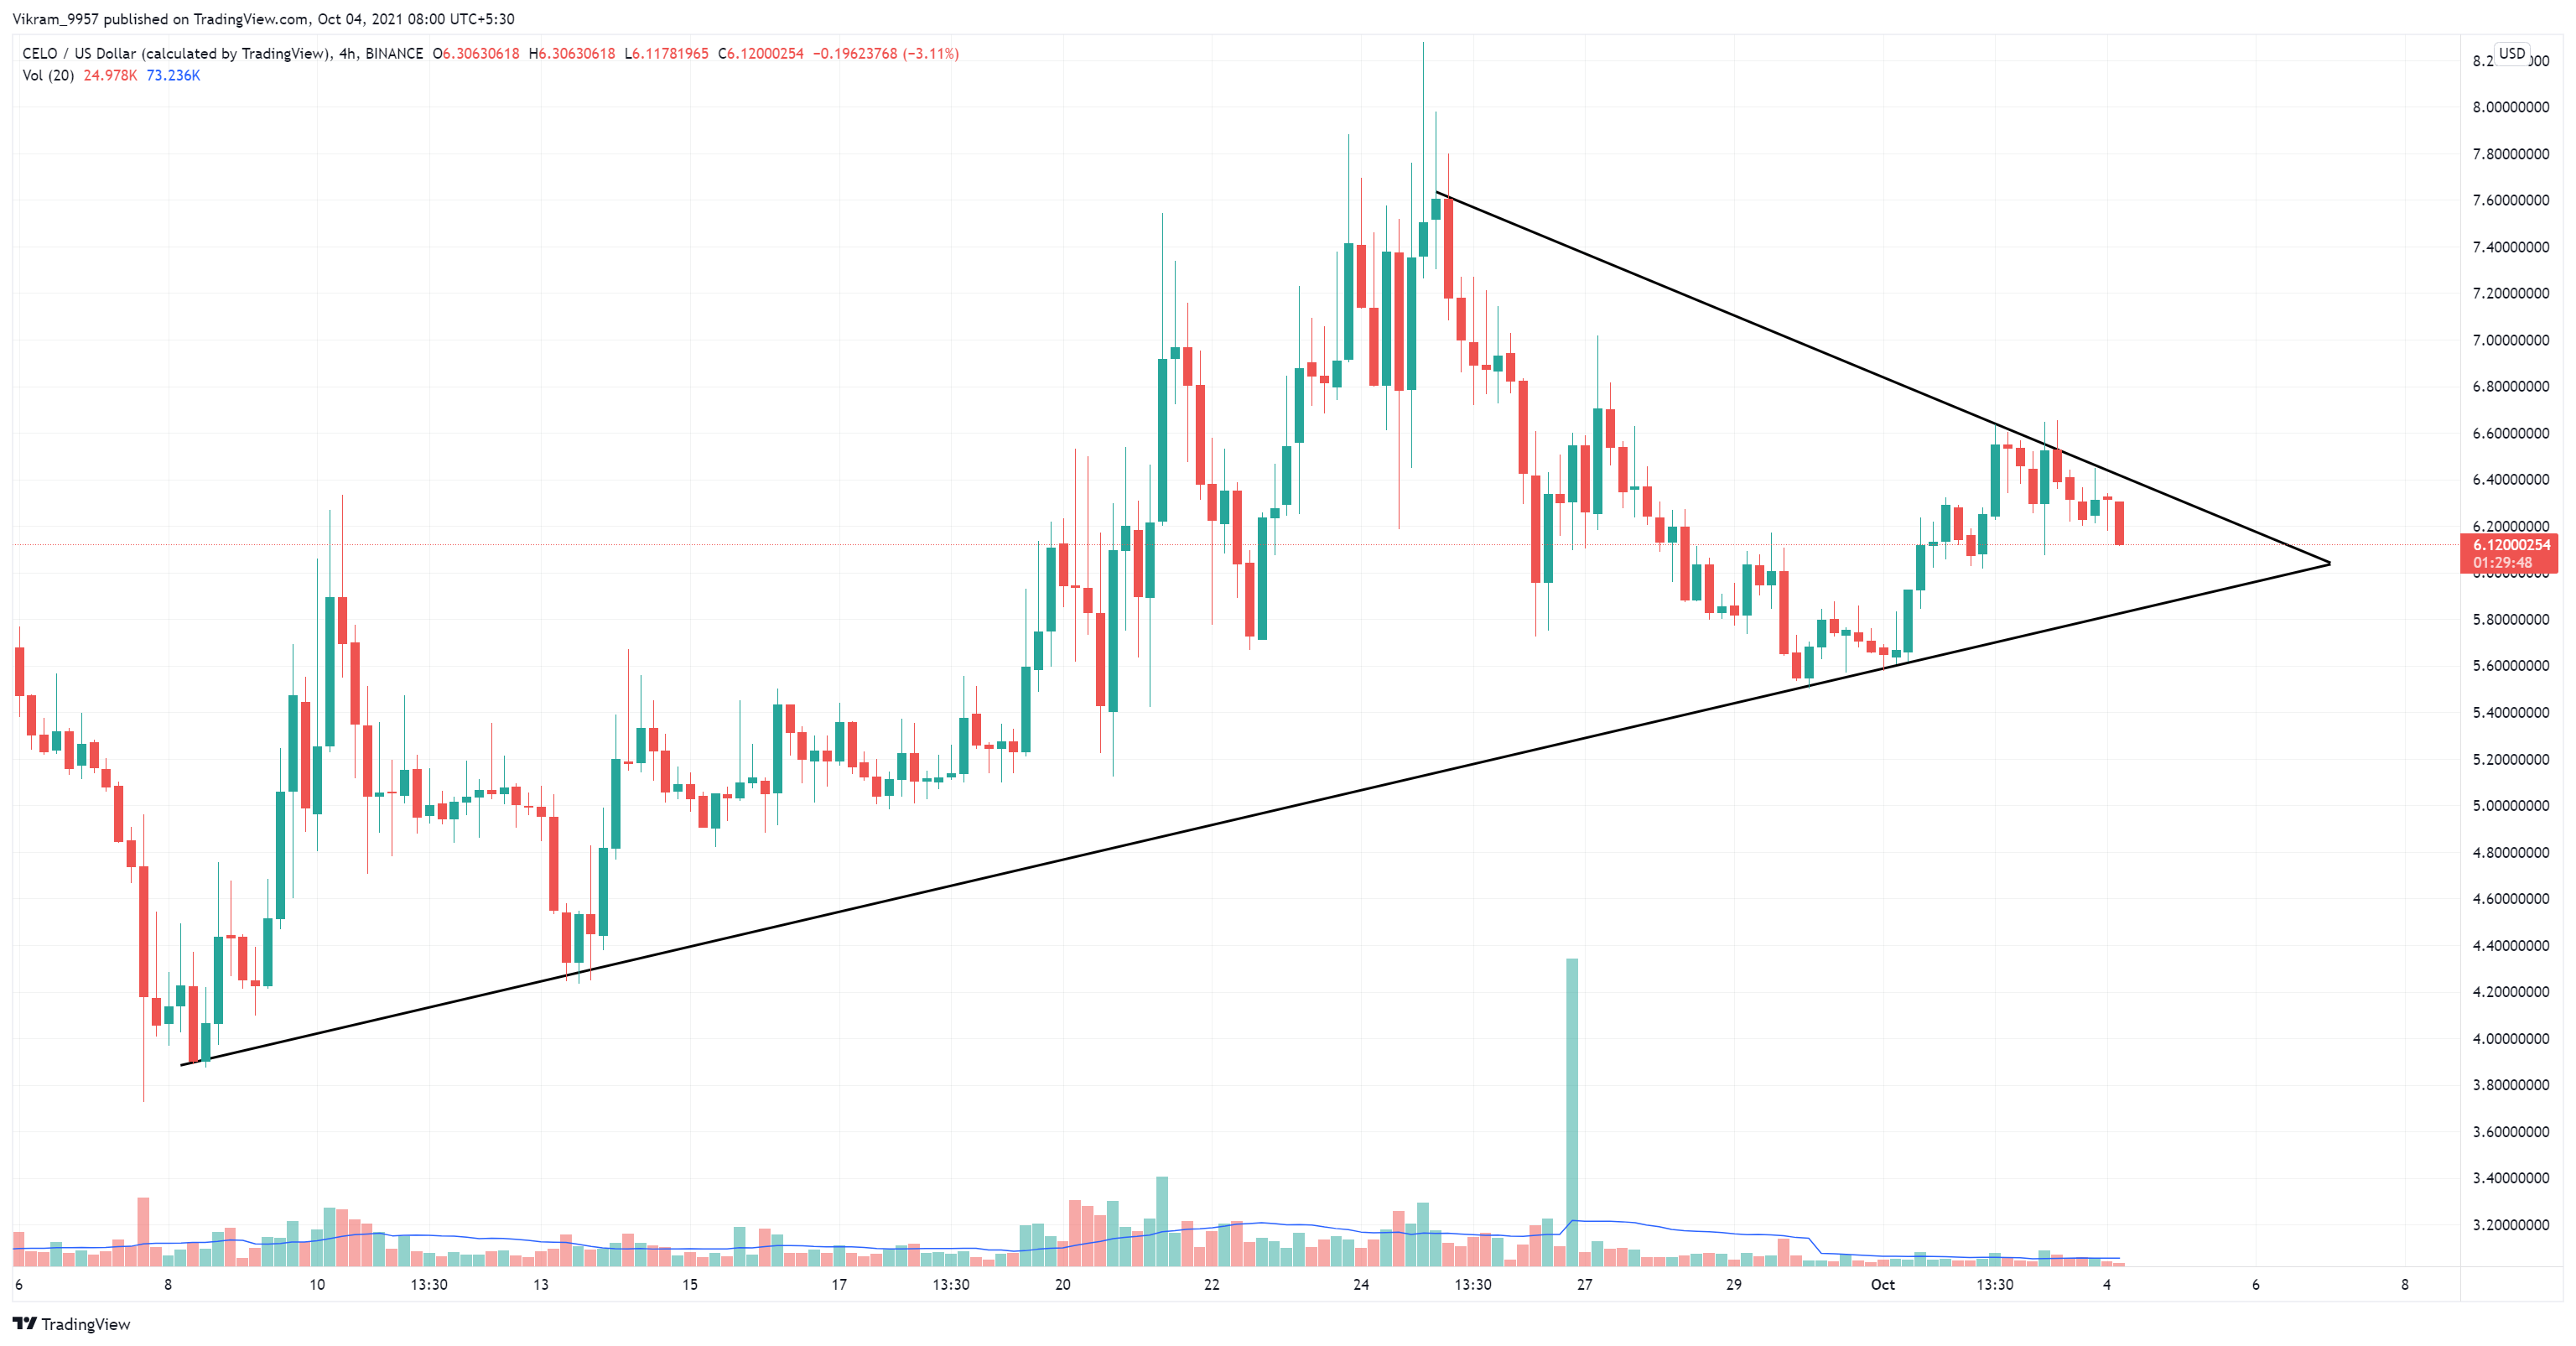
The price action indicates a support trendline in action. Furthermore, the trendline has pushed the price higher multiple times. Thus, the recent retracement to the trendline can lead to another bullish reversal. However, the buying opportunity will arise only upon the breakout of the resistance trendline.
The bullish reversal may find resistance near the $6.8 or $7.8 resistance level. On the flip side, the support levels are at $5.5 and $5.0.
CELO crypto trades above all the crucial Exponential Moving Averages in the daily chart. Moreover, the rising 50, 100, and 200 days EMA maintains a bullish alignment. Therefore, the fallout of the price pattern can find support at these EMAs.
The MACD and signal lines are above the zero mark on the daily chart. Thus, generating a buy signal.
The RSI slope moves above the central line in the daily chart. In addition, the slope moves sideways slightly above the 50% level. However, the slope can shortly rise to the overbought territory as the underlying bullishness increases.
Upcoming Trend
CELO Token's technical analysis indicates that CELO Token is ready to start a new trend. The breakout of the price pattern will decide the upcoming trend.
Furthermore, the 50% Fibonacci level and the daily EMAs provide excellent support spots that can drive the price higher. Thus, resulting in a bullish reversal.