- XRP’s price has dropped slightly in the last 24 hours.
- The remittance token’s price is being squeezed by the 9-day EMA and a resistance level.
- Technical indicators show that XRP’s price is at a decisive point.
Ripple is a technology that acts as both a cryptocurrency and a digital payment network for financial transactions. It was first released in 2012 and was co-founded by Chris Larsen and Jed McCaleb.
Ripple’s main process is a payment settlement asset exchange and remittance system, similar to the SWIFT system for international money and security transfers, which is used by banks and financial middlemen dealing across currencies.
The token used for the cryptocurrency is premined and utilizes the ticker symbol XRP. Ripple is the name of the company and the network, and XRP is the cryptocurrency token. The purpose of XRP is to serve as an intermediate mechanism of exchange between two currencies or networks – as a sort of temporary settlement layer.
Current Market Standing
Ripple (XRP) is ranked as the 6th biggest crypto by market cap, according to CoinMarketCap, and experienced a 24-hour drop in price of 0.60% to take its price down to $0.4104. This also puts its total market cap at approximately $20.85 billion at press time.
Despite the negative 24-hour performance of XRP’s price, the remittance token’s price is still up 0.86% over the last 7 days.
Technical Overview
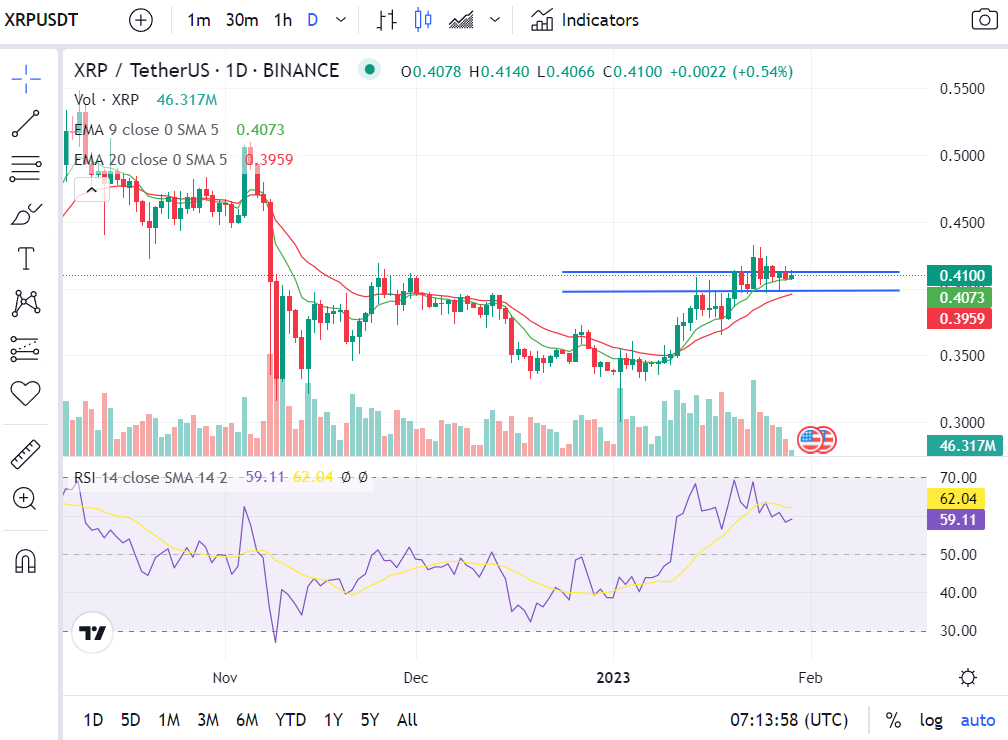
The price of XRP is being squeezed by the 9-day EMA line and the resistance level at $0.4127, as it consolidates on the 9-day EMA line. It seems that the remittance token’s price wants to break below the EMA support as XRP’s price faces a lot of sell pressure presently. This sell pressure is indicated by the wick present at the top of today’s daily candle.
Should the squeeze play out, XRP’s price may look to either look to breakout towards the upside or make a dramatic move down. The relative positions of the 9-day and 20-day EMA lines favors a breakout towards the upside.
However, the daily RSI indicator points more towards XRP’s price dropping in the coming days, given that the daily RSI line is positioned below the daily RSI SMA line. Despite this, the daily RSI line is sloped positively towards overbought territory, which is a slight bullish sign that investors and traders may want to keep an eye on.
Confirmation of the bearish thesis will be if ADA’s price breaks below the 9-day EMA line in the next 24 hours. Meanwhile, the bullish thesis will be confirmed when the daily RSI line crosses above the daily RSI SMA line.
Disclaimer: The views and opinions, as well as all the information shared in this price prediction, are published in good faith. Readers must do their research and due diligence. Any action taken by the reader is strictly at their own risk. Coin Edition and its affiliates will not be held liable for any direct or indirect damage or loss.