Key highlights:
- FTM is up a sweet 5% this week as it sits above $1.20
- The cryptocurrency needs to break resistance at around $1.35 (bearish .382 Fib) to start recovering to the September highs
- Against Bitcoin, FTM is struggling to break resistance at 3100 SAT but, when it does, it should start surging
| Fantom price | $1.26 |
|---|---|
| Key FTM resistance levels | $1.35, $1.40, $1.46, $1.50, $1.57 |
| Key FTM support levels | $1.20, $1.10, $1.00, $0.96, $0.85 |
*Price at the time of publication
Fantom is up a small 5% on the week as the cryptocurrency sits above $1.20 (20-day MA). The FTM cryptocurrency set a new ATH price at around $1.90 earlier in September and has been in a slow downtrend ever since.
Last week, FTM managed to meet support at $1.00 (.618 Fib Retracement), which allowed the market to stabilize and rebound. Since bouncing, FTM managed to break back above the 20-day MA but is now struggling to break resistance at $1.35 (bearish .382 Fib Retracement).
Fantom is a Layer-1 blockchain and smart contract platform that aims to be a key player in DeFi. It uses the Asynchronous Byzantine Fault Tolerance (aBFT) algorithm. This type of architecture allows the Fantom Network to be highly scalable and conduct transactions with significant speed while not sacrificing decentralization.
The project recently released a 300 million FTM incentive program that caused the coin to surge aggressively in September. In fact, social media metric data from LunaCRUSH shows that the total number of social media mentions increased 35% over the last month. In addition to this, the total number of social engagements increased 95%, and the average daily social contributors increased 22%.
Fantom is now ranked in the 47th position as it currently holds a $3.18 billion market cap value.
Fantom's 1-Month activity:
— LunarCRUSH ? Social Listening for Crypto (@LunarCRUSH) August 28, 2021
Price $0.50331312 +98.04%
67,305 social mentions +34.08%
95,793,815 social engagements +95.86%
1,660 average daily social contributors +22.24%https://t.co/UNc78mnwoG $ftm #fantom pic.twitter.com/Us6Lz8Mw1A
Let us continue to take a look at the markets and see where they might be heading.
Fantom price analysis
What has been going on?
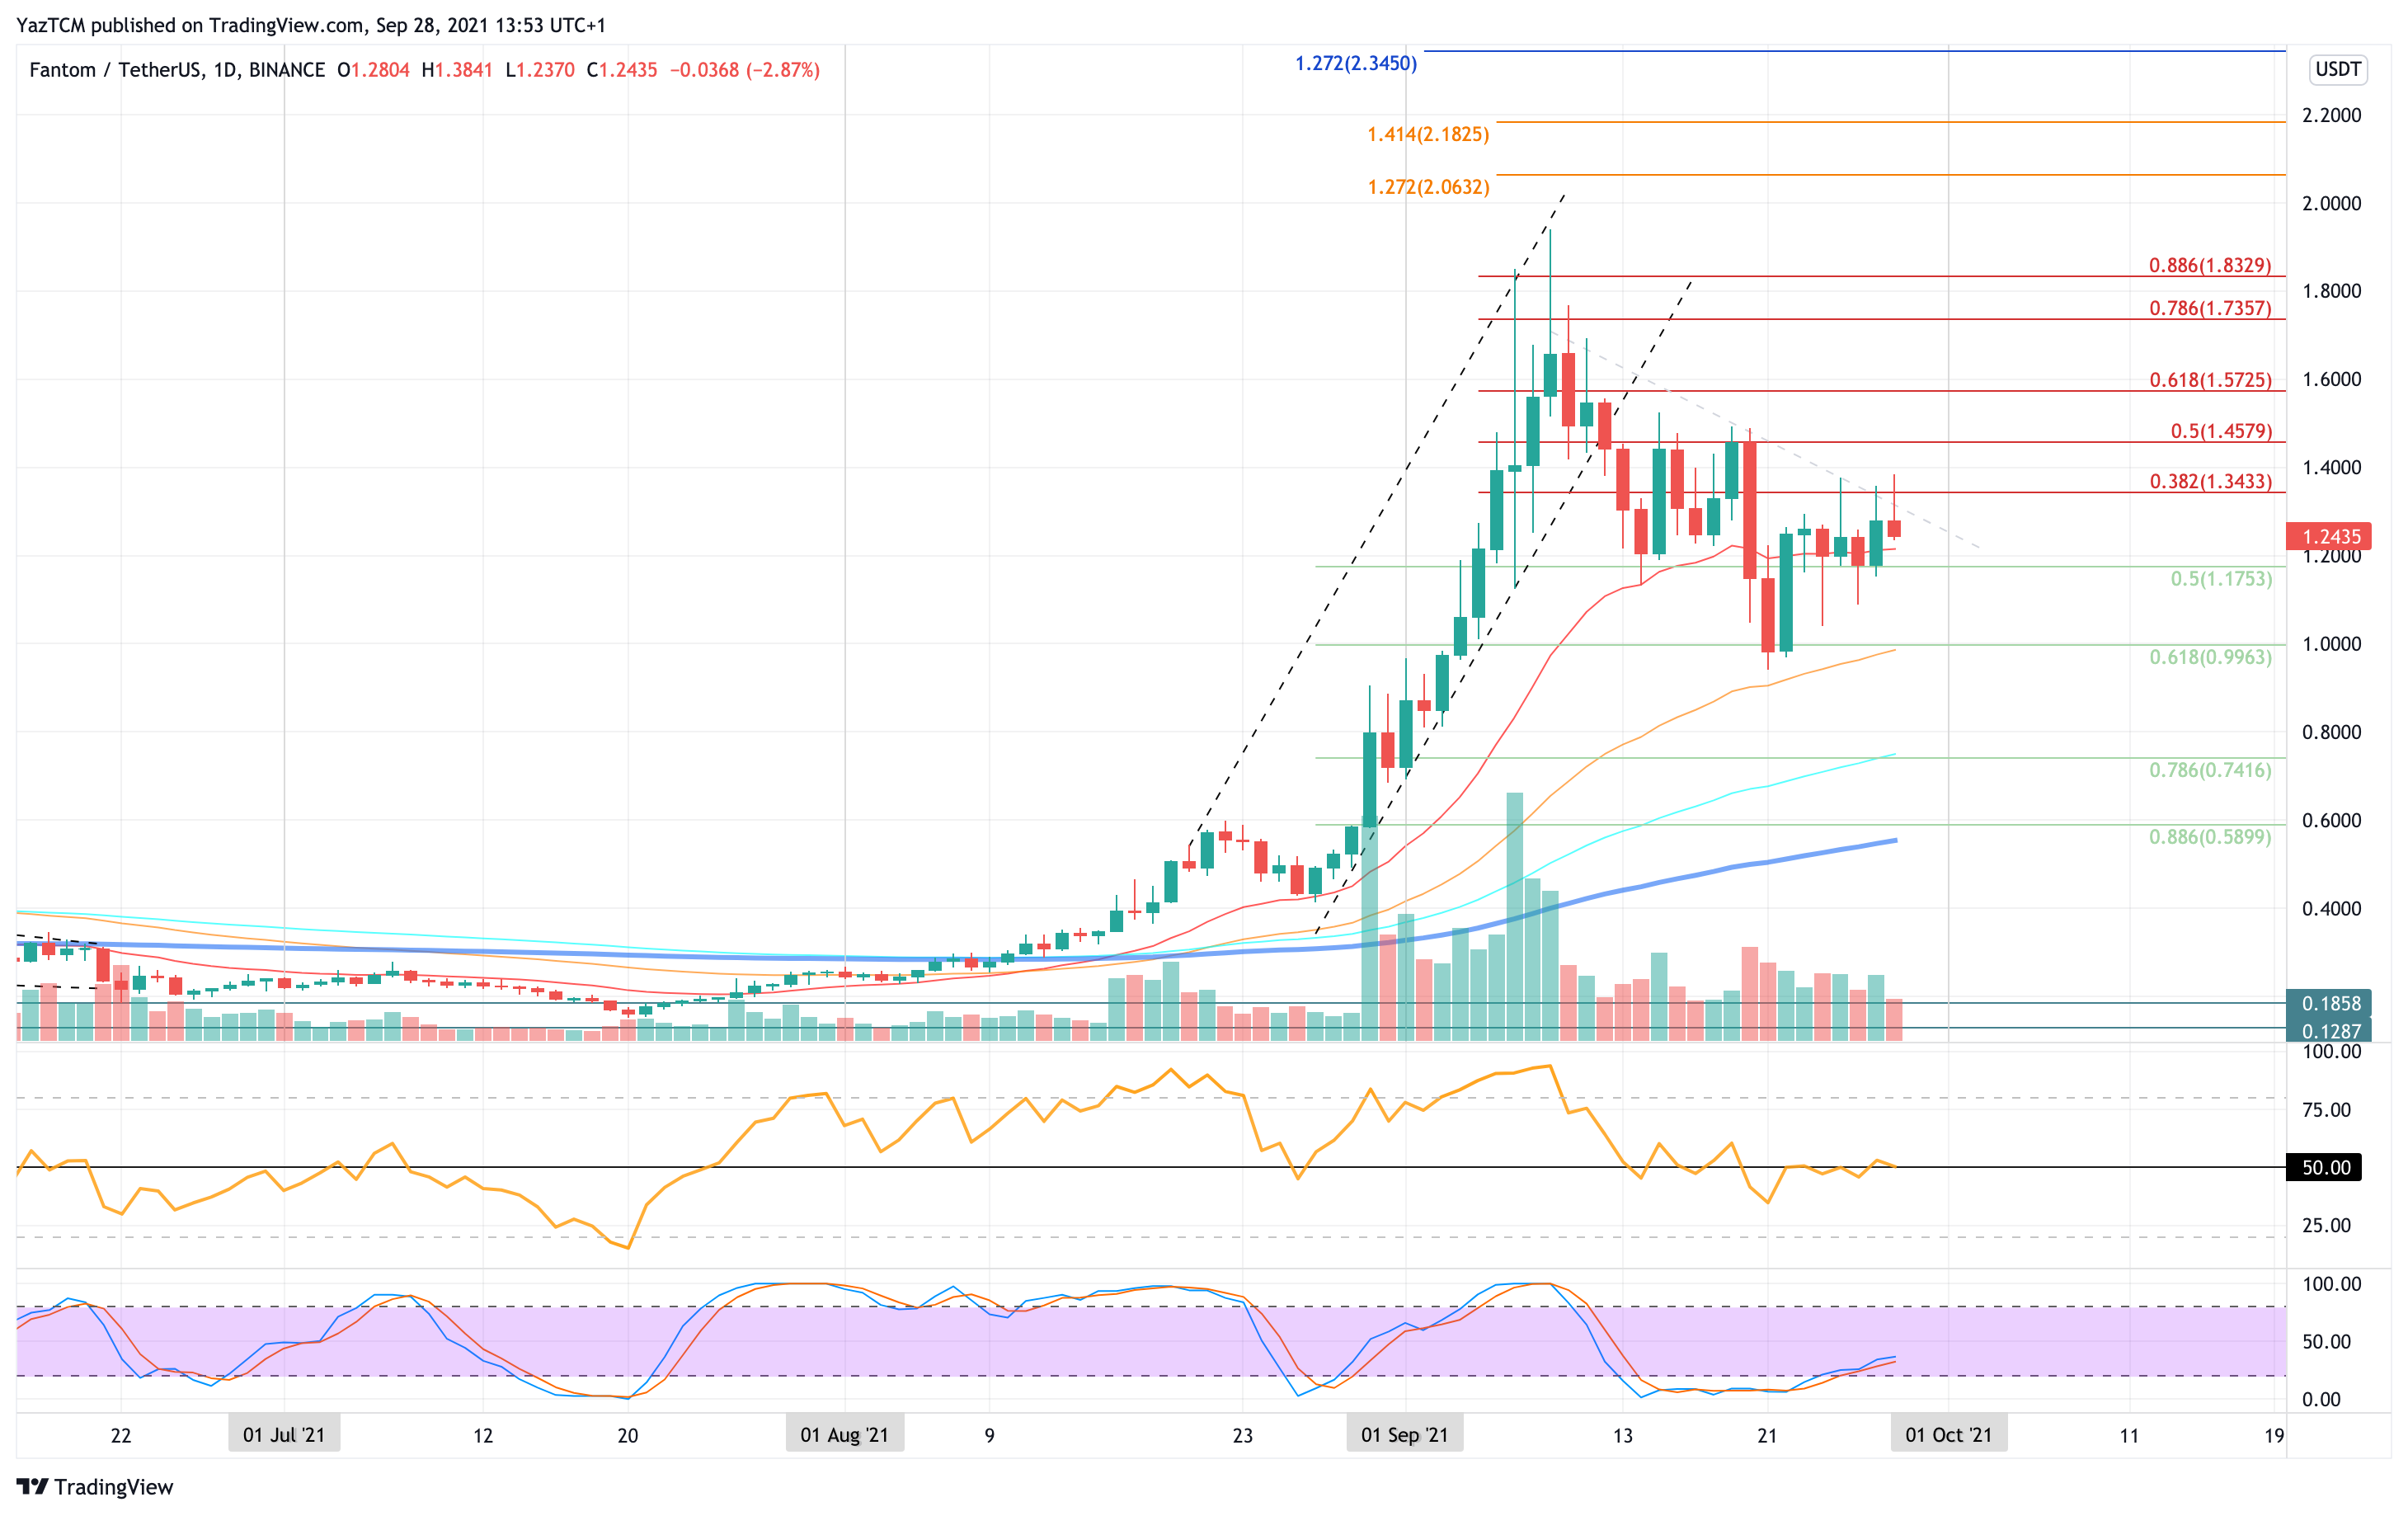
Taking a look at the daily chart above, we can instantly see the ascending price channel in early September that allowed FTM to explode higher. The price channel started toward the end of August when FTM finally broke resistance at $0.6.
As September started to trade, FTM surged higher to set a new ATH at around $1.90. From there, FTM rolled over and would break beneath the ascending trend line to initially finding support at around $1.20 (.5 Fib Retracement).
Last week, FTM broke beneath the support at $1.20 and the 20-day MA until additional support was met at $1 (.618 Fib Retracement). Luckily, the buyers managed to regroup here, and FTM quickly bounced to break back above the 20-day MA level.
It is now struggling to overcome resistance at $1.35, provided by a bearish .382 Fib Retracement. FTM would need to break this resistance in order to kick start a recovery run back toward the September highs again.
Fantom Network price short-term prediction: Bullish
FTM has to be considered as strongly bullish right now. The coin would need to break beneath $1.00 (50-day MA) to turn neutral and would have to continue much further beneath $0.75 (100-day MA) to be in danger of turning neutral in the short term.
If the sellers do push lower, the first support lies at $1.20 (20-day MA & .5 Fib Retracement). This is followed by $1.00 (.618 Fib Retracement & 50-day MA), $0.85, $0.8, anbd $0.75 (.786 Fib Retracement & 100-day MA).
Where is the resistance toward the upside?
On the other side, the first resistance is expected at $1.35 (bearish .382 Fib Retracement). The resitance here is further bolstered by a descending trend line. Above $1.40, additional resistance lies at $1.45 (bearish .5 Fib Retracement), $0.57 (bearish .618 Fib Retracement), $1.74 (bearish .786 Fib Retracement), and $1.80.
Additional resistance lies at $1.90, $2.00, $2.06, $2.20, and $2.50.
FTM/BTC price analysis
What has been going on?
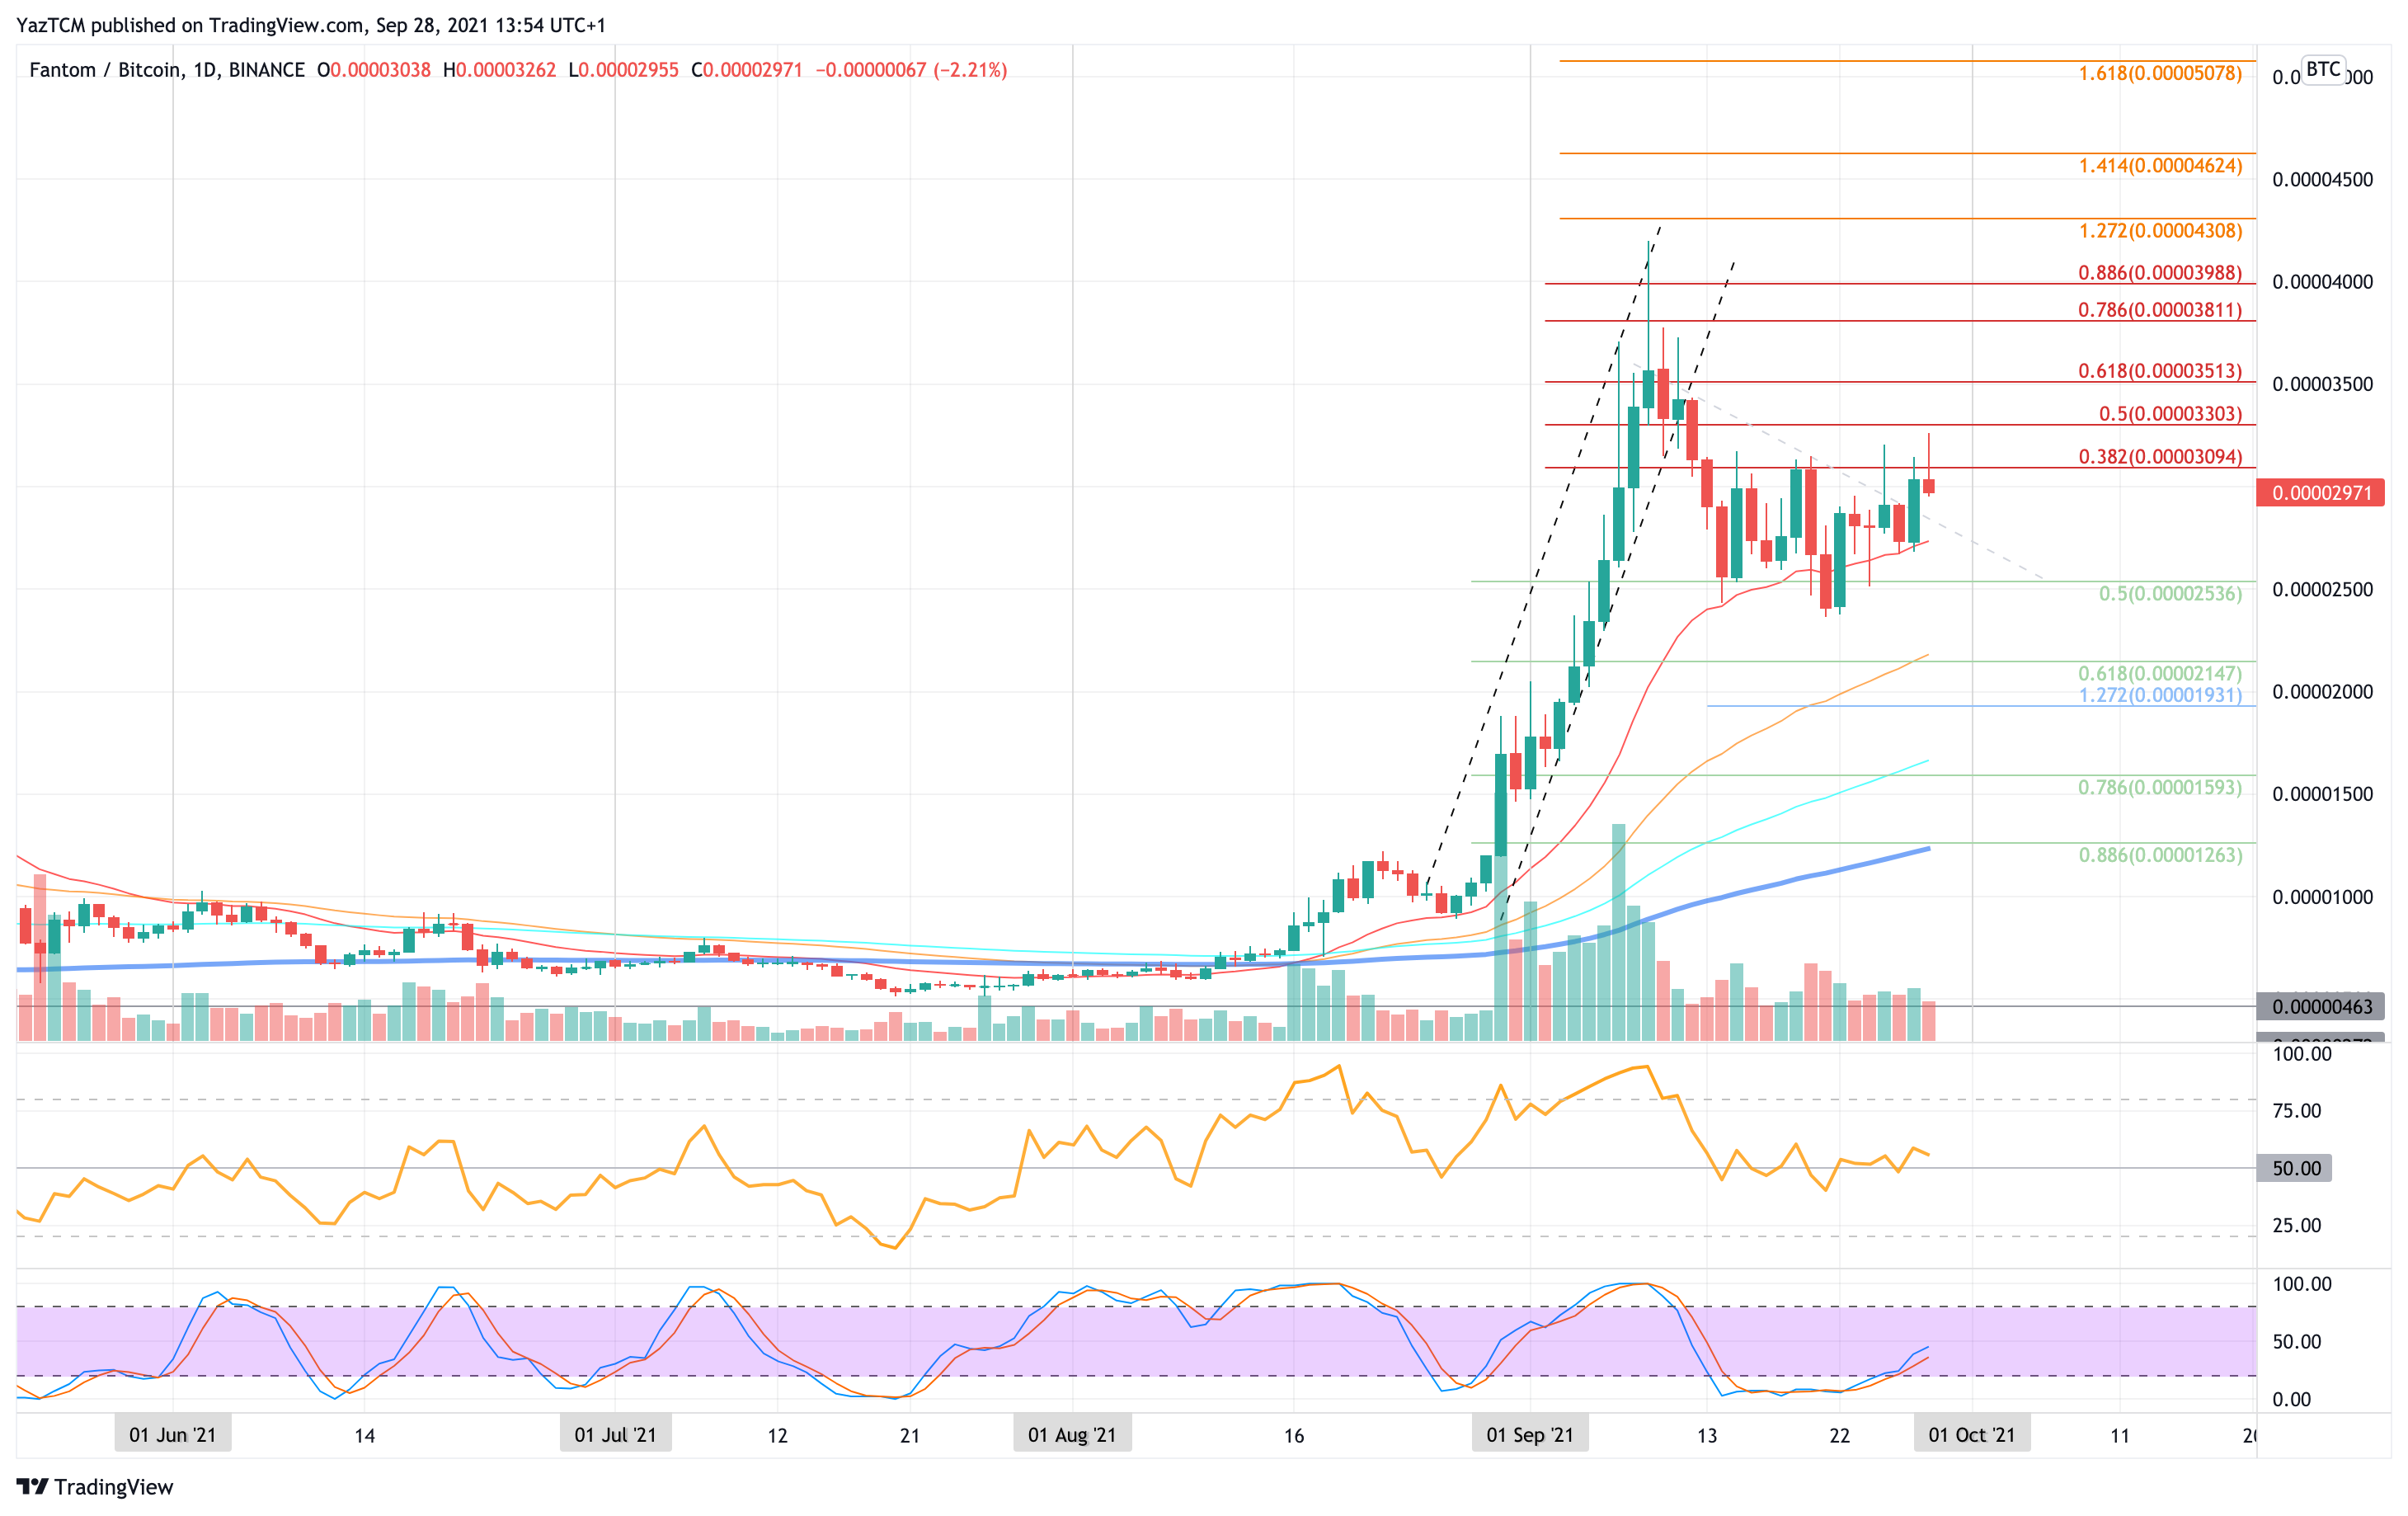
FTM is in a similar boat against BTC as the cryptocurrency sits above the 20-day MA level. The coin reached above 4,000 SAT when FTM set the new ATH at the start of September but has been falling ever since.
It did manage to find support at 2,500 SAT (.5 Fib Retracement) and has held this support ever since.
It is now struggling to break resistance at around 3,100 SAT (bearish .382 Fib Retracement). It must break above this resistance to be able to push higher and recover back toward 4,000 SAT.
Fantom Network price short-term prediction: Bullish
FTM is considered bullish against BTC. It would need to fall beneath 2,500 SAT (.5 Fib Retracement) to turn neutral and would have to continue further beneath 1,800 SAT to be in danger of turning bearish in the short term.
If the sellers do push lower, the first support lies at 2,600 SAT (20-day MA). This is followed by support at 2,500 SAT (.5 Fib Retracement), 2,300 SAT, 2,150 SAT (50-day MA & .618 Fib Retracement), and 2,000 SAT.
Beneath 2,000 SAT, additional support lies at 1,930 SAT (downside 1.272 Fib Extension), 1,600 SAT (100-day MA), 1,500 SAT, and 1,260 SAT (.886 Fib Retracement & 200-day MA).
Where is the resistance toward the upside?
On the other side, the first resistance lies a 3,100 SAT (bearish .382 Fib Retracement). This is followed by 3,300 SAT (bearish .5 Fib Retracement), 3,500 SAT (bearish .618 Fib Retracement), 3,810 SAT (bearish .786 Fib Retracement), and 4,000 SAT.
Additional resistance lies at 4,300 SAT, 4,500 SAT, and 4,625 SAT.