The Bitcoin (BTC) and the Ethereum (ETH) prices are retracing in what is likely wave four of a five-wave upward movement. The XRP price could break out from a long-term symmetrical triangle.
Bitcoin Pulls Back
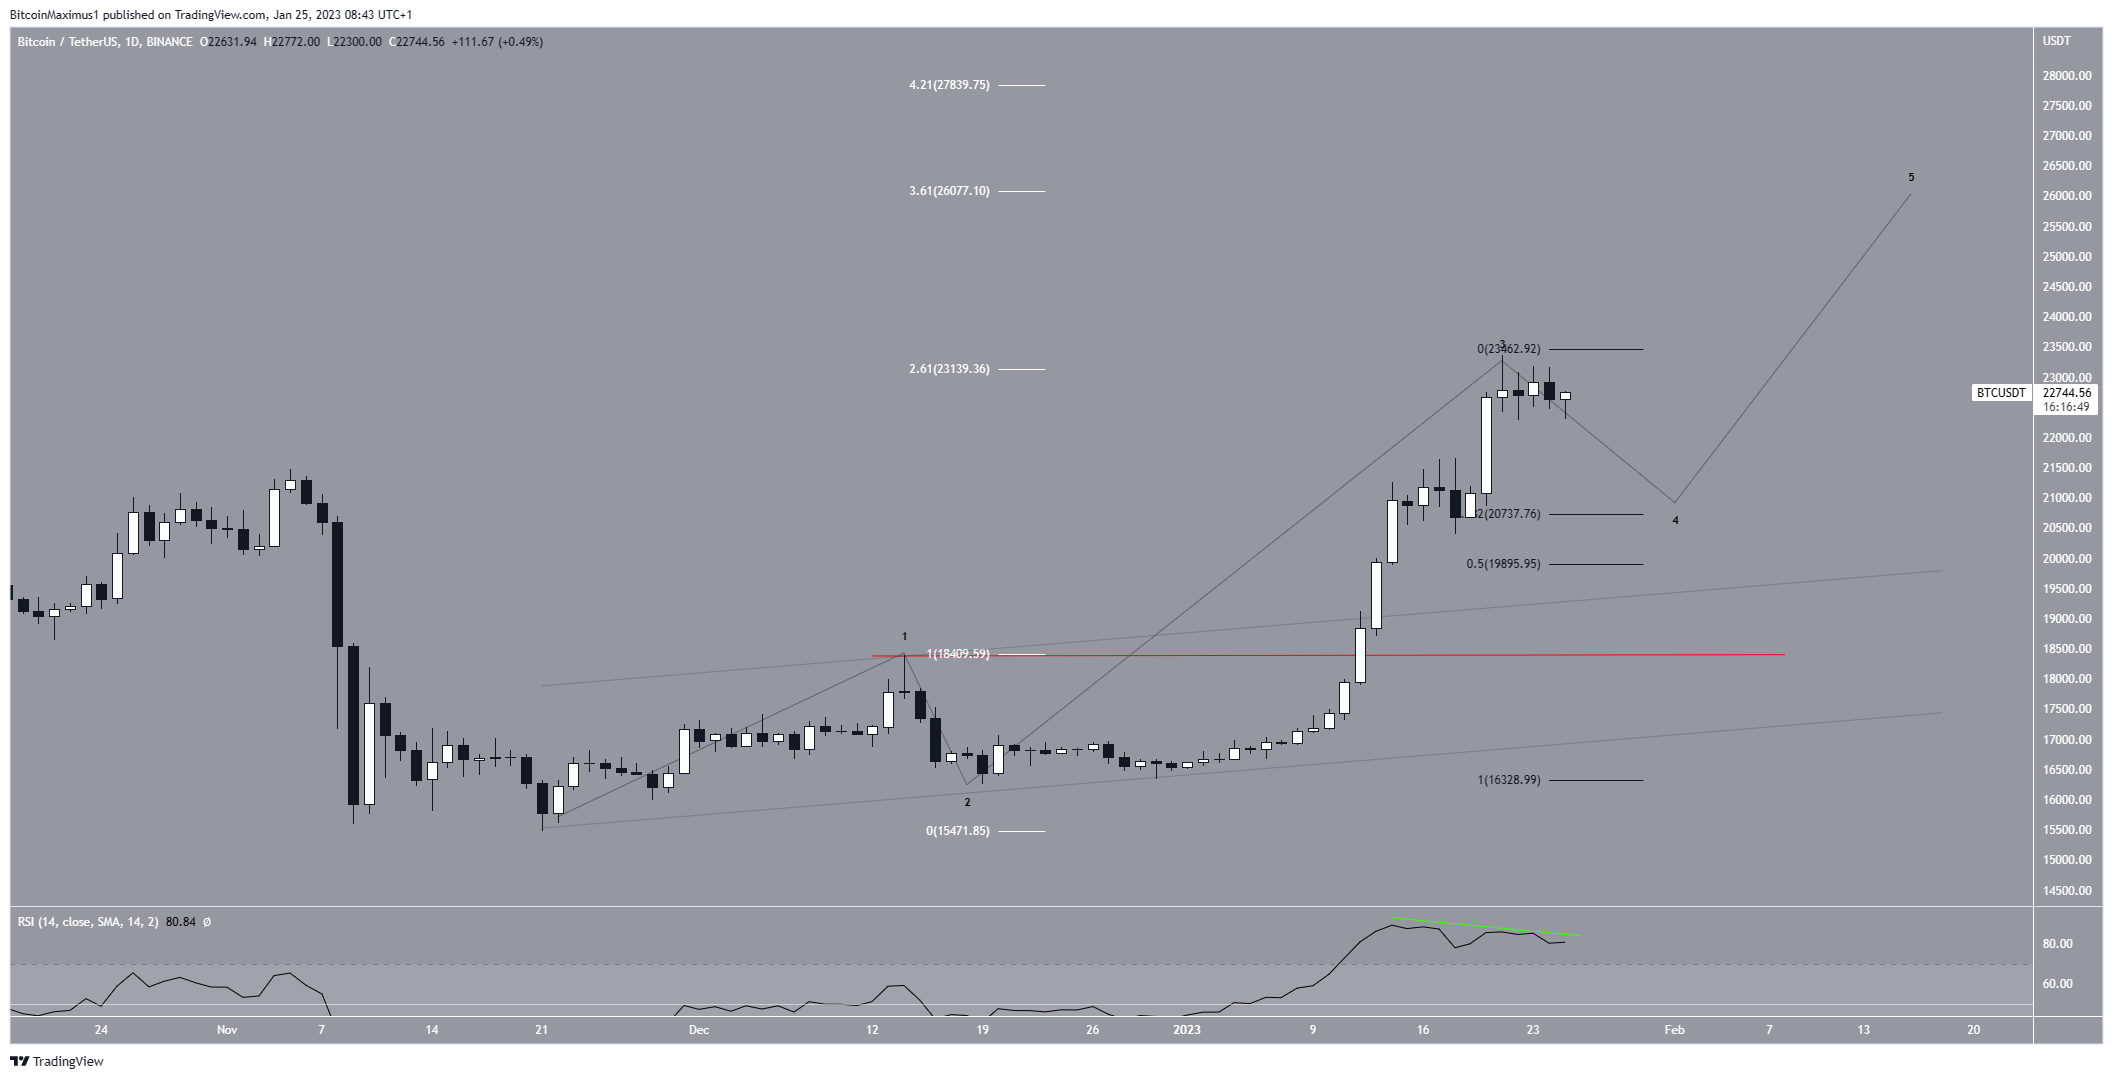
The Bitcoin price has been moving upward since Nov. 22. On Jan. 13, it broke out from the channel and reached a high of $23,371 eight days later.
However, it decreased slightly after the RSI generated a bearish divergence (green line).
Due to the breakout from the channel, the increase is likely part of wave three of a five-wave upward movement (black). If so, the most likely outline is a decrease as part of wave four, which would take the BTC price to the 0.382 or 0.5 Fib retracement support levels at $20,737 and $19,896, respectively.
Afterward, the fifth and final wave could reach a top near $26,077, created by the 3.61 extension of wave one (white). For a longer-term count, click here.
If the BTC price moves above its Jan. 21 high of $23,371, it would mean that the retracement is complete and a movement toward $26,077 will commence.
On the other hand, a drop below the wave one high at $18,410 (red line) would invalidate this bullish price analysis.
Ethereum Struggles With Resistance
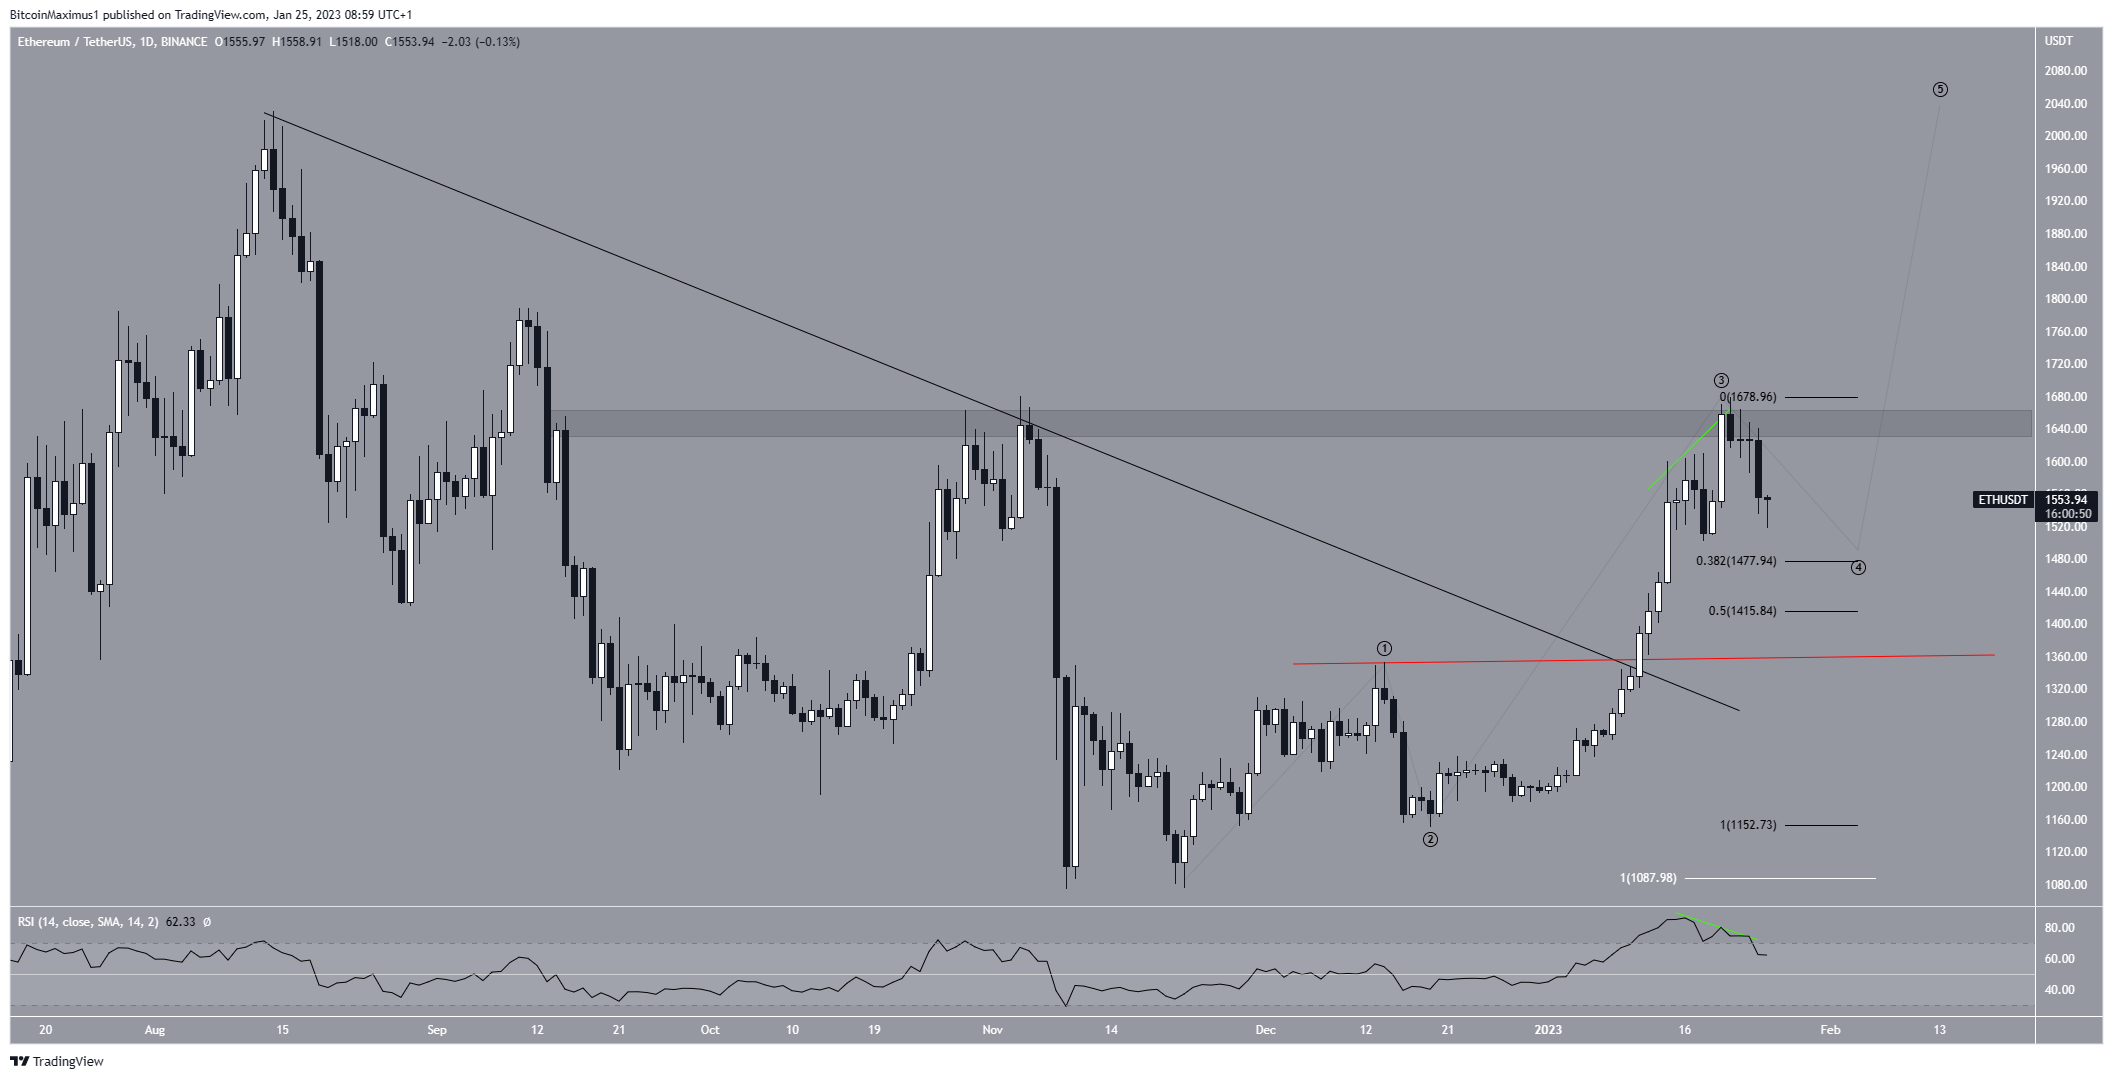
ETH is the native token of the Ethereum blockchain. It was created by Vitalik Buterin and specializes in smart contracts. The Ethereum price movement is somewhat similar to that of Bitcoin. The price broke out from a descending resistance line on Jan. 11 and has increased since. On Jan. 21, it reached a high of $1,679. However, it fell afterward due to the daily RSI generating bearish divergence (green line).
The ETH price is likely in wave four of a five-wave upward movement. So, the current correction could end near the 0.382-0.5 Fib retracement support levels at $1,488-$1,416. Afterward, wave five would be expected to take the Ethereum price above the Aug. 2022 high at $2,030.
Like the Bitcoin price, a decrease below the wave one high (red line) at $1,352 would invalidate this bullish outlook.
XRP Attempts Breakout
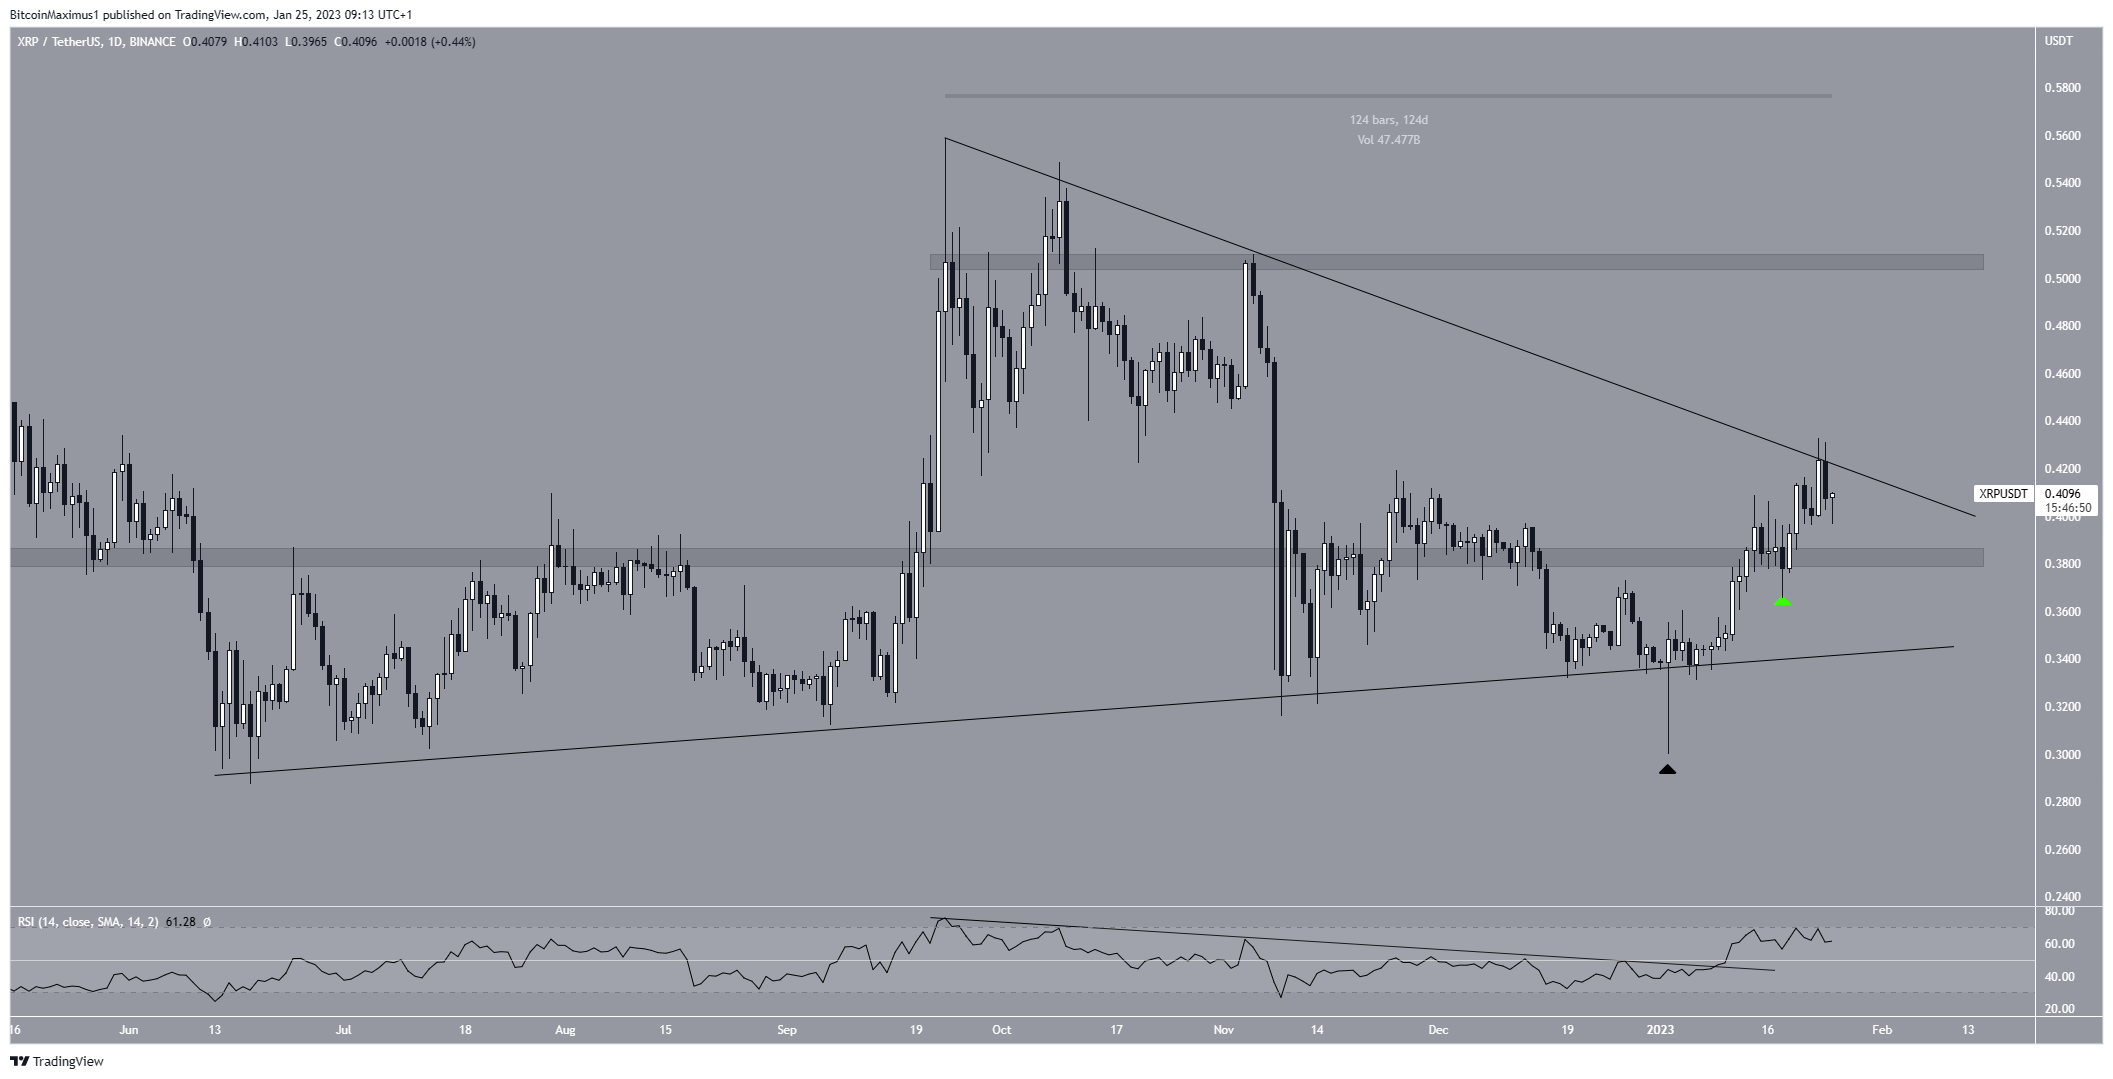
On Jan. 2, the XRP price created a bullish hammer candlestick (black icon), initiating the ongoing upward movement. On Jan. 14, it broke out from the $0.38 resistance area and validated it as support four days later.
Over the past 24 hours, XRP has attempted to break out from a descending resistance line in place for 124 days. If it is successful, the price could increase to the next resistance at $0.51.
If it gets rejected instead, a drop to $0.38 would be expected. The daily RSI is still increasing and has not generated any bearish divergence. As a result, a breakout is the most likely scenario.
To conclude, the Bitcoin and Ethereum prices are both in the process of retracing after considerable upward movements. The XRP price is attempting to break out from a descending resistance line. Decreases below $18,410 and $1,352, respectively, would make the Bitcoin and Ethereum trends bearish, while a close below $0.38 would do the same for the XRP price.