Bulls could not hold the gained initiative as most of the coins are in the red zone.
SOL/USD
Solana (SOL) is one of the biggest losers today, going down by 4.13%.
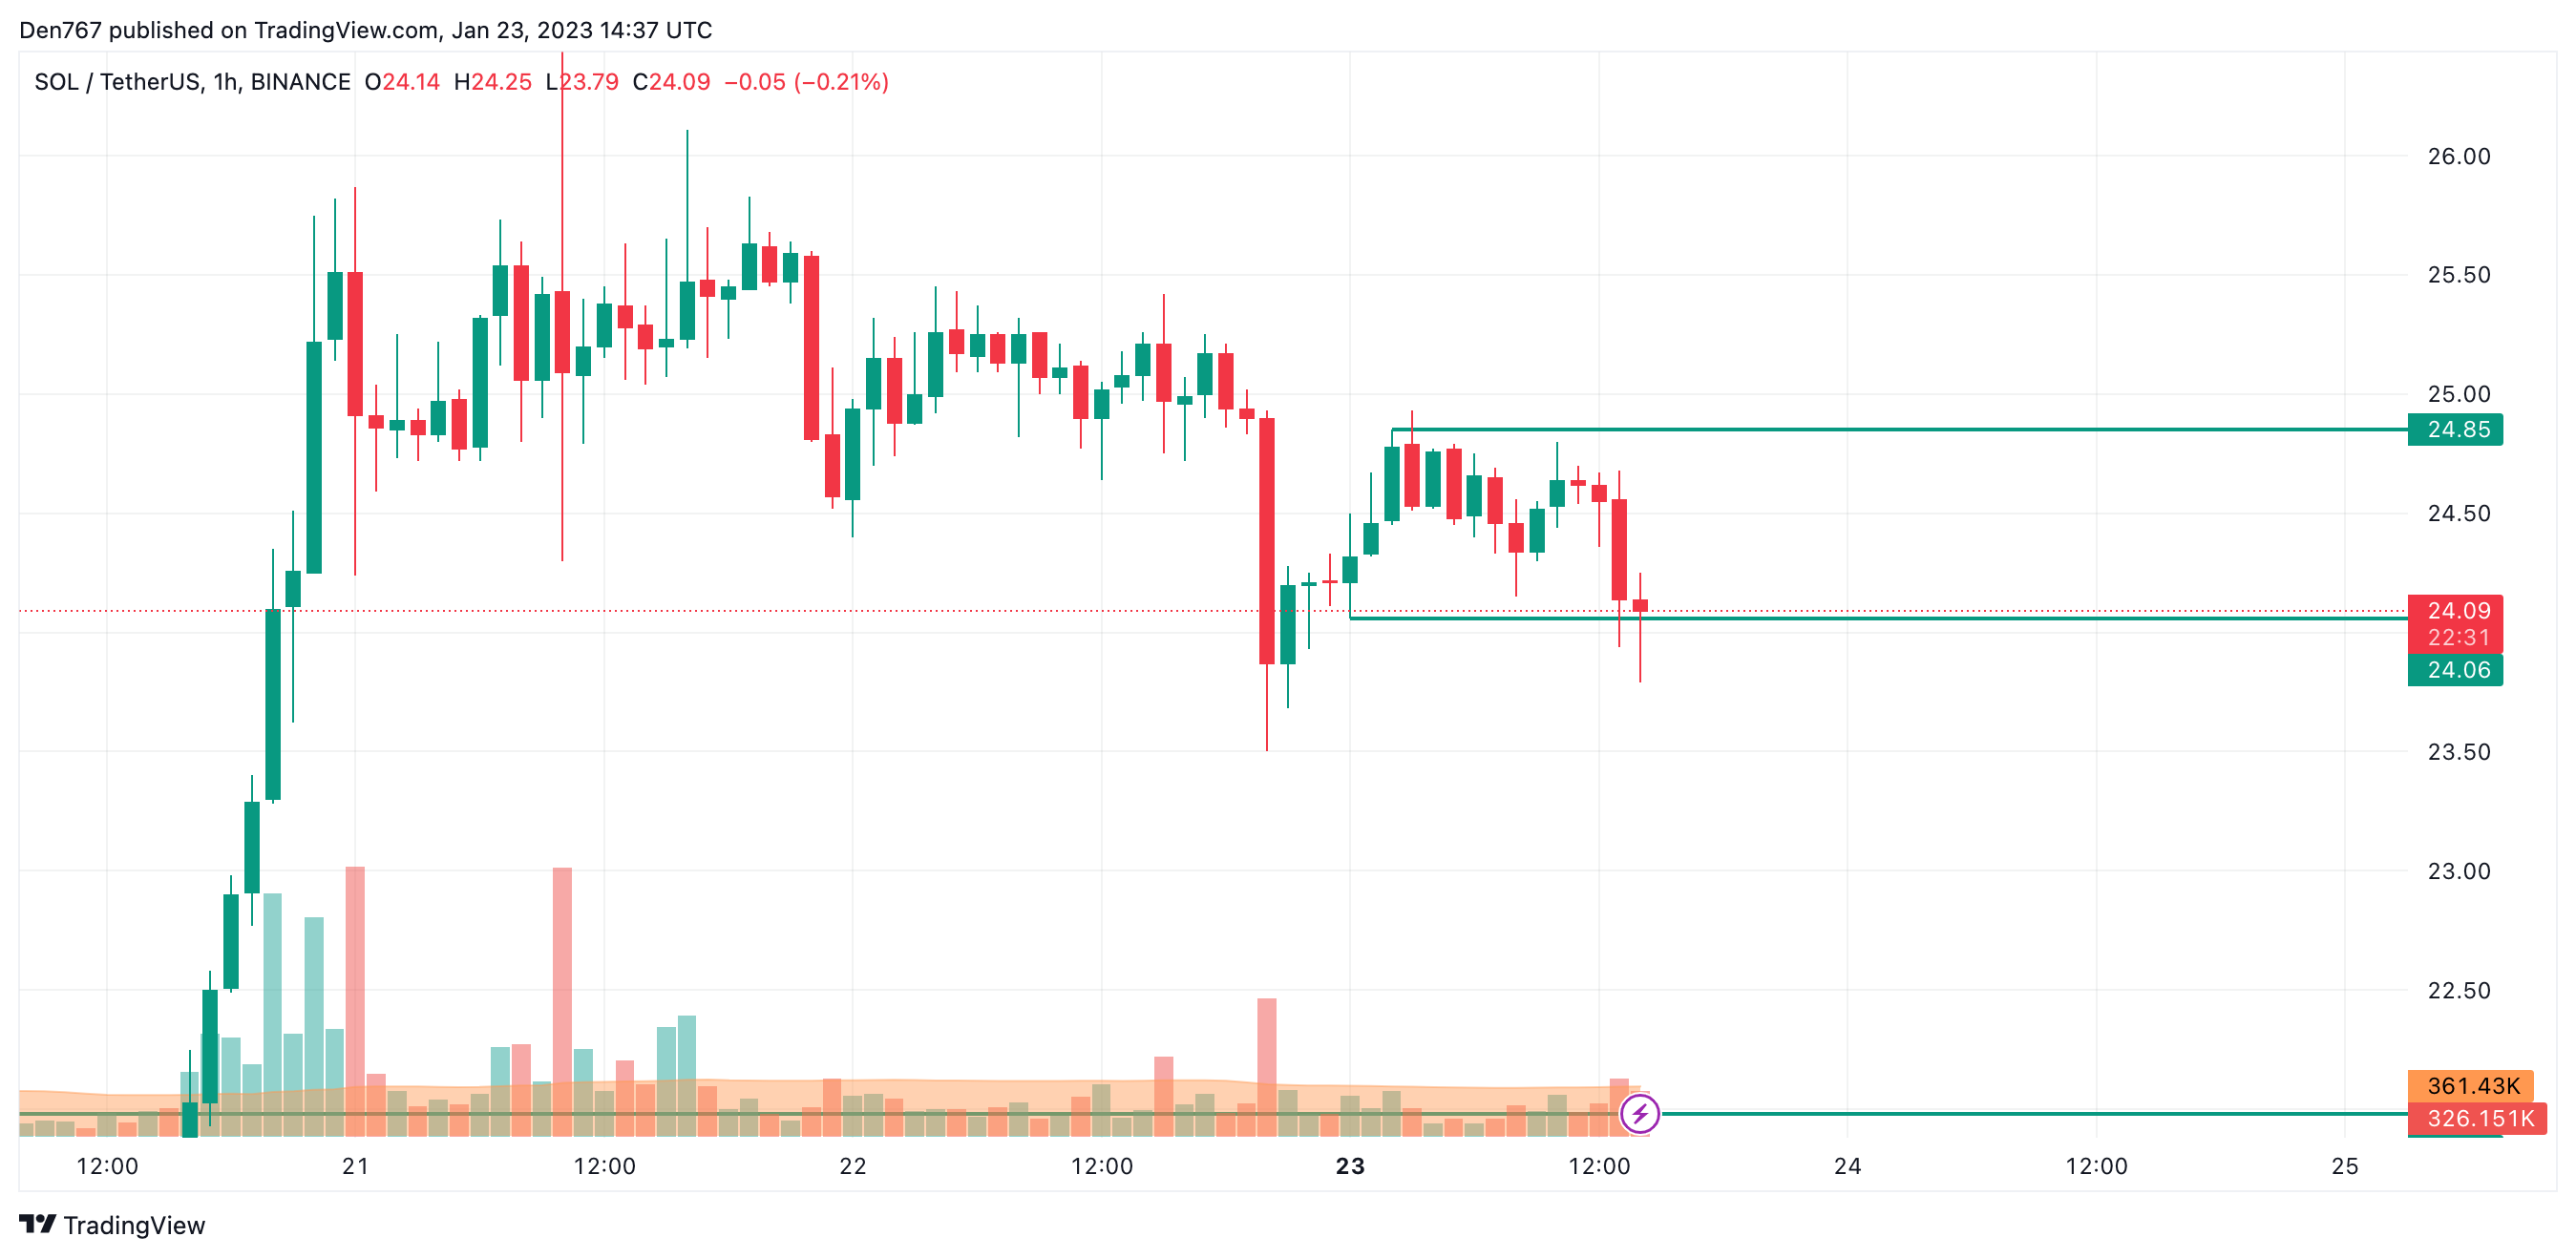
On the hourly chart, the price of Solana (SOL) has returned to the local support level of $24.06. If buyers cannot restore the initiative by the end of the day, the breakout may lead to the test of the $23.5 level tomorrow.
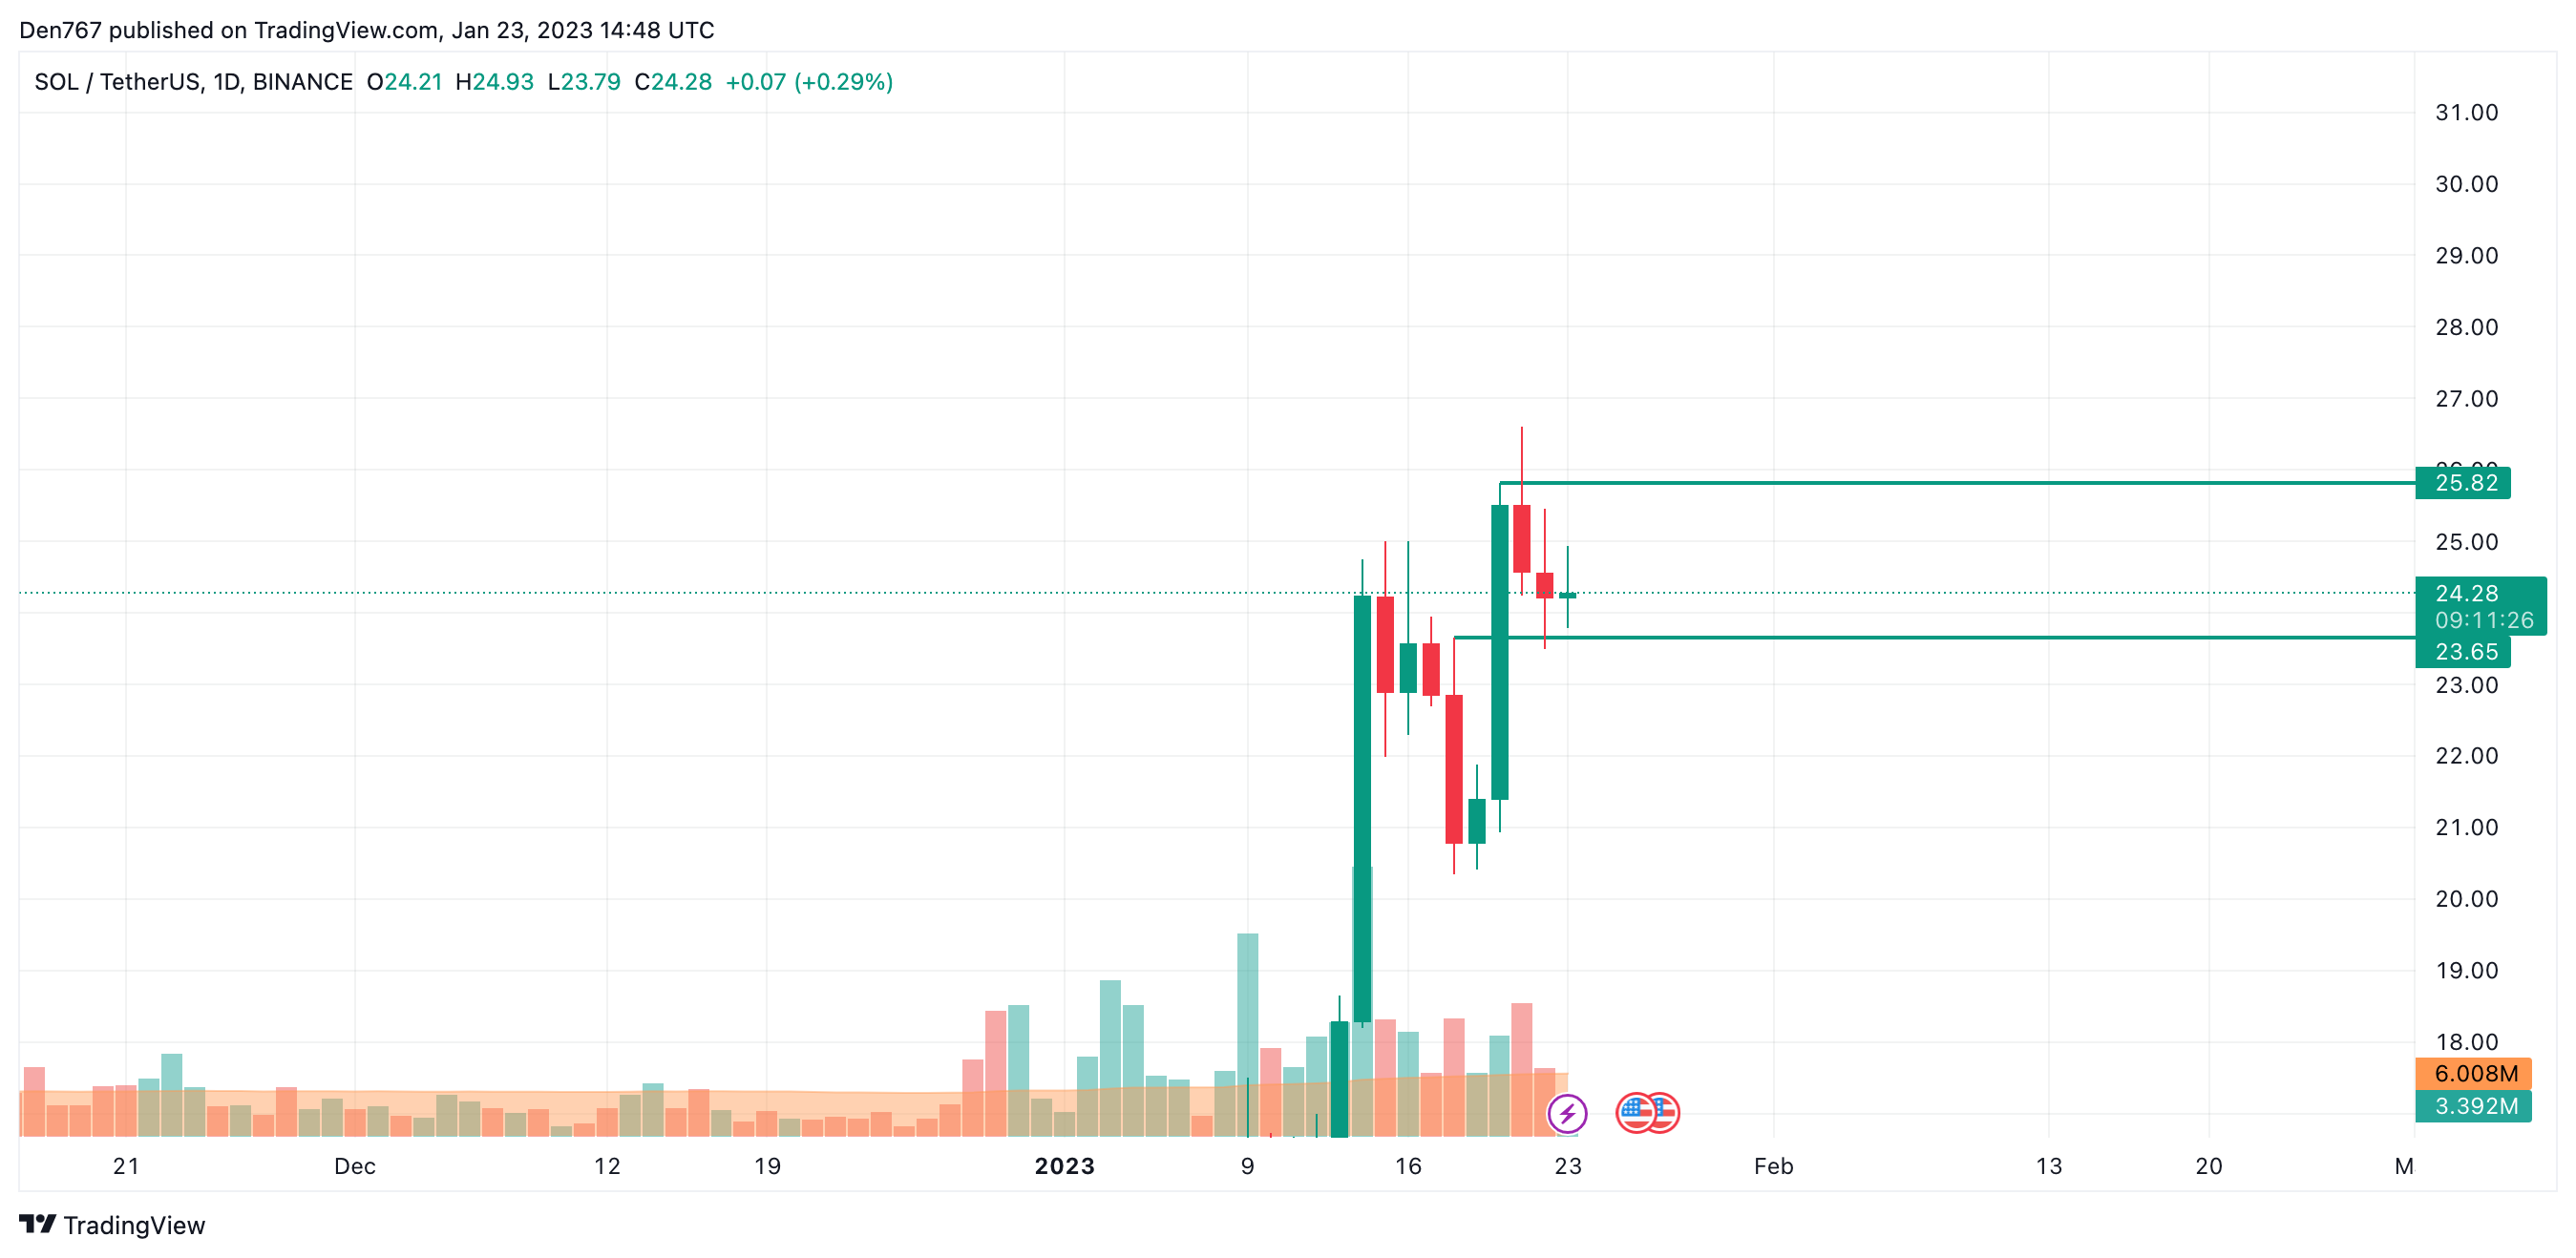
On the daily chart, the situation is also more bearish than bullish as the price is below the important $25 mark. If the candle closes near the support at $23.65, the impulse may continue to the zone of $22-$23. Such a scenario is relevant until the end of the month.
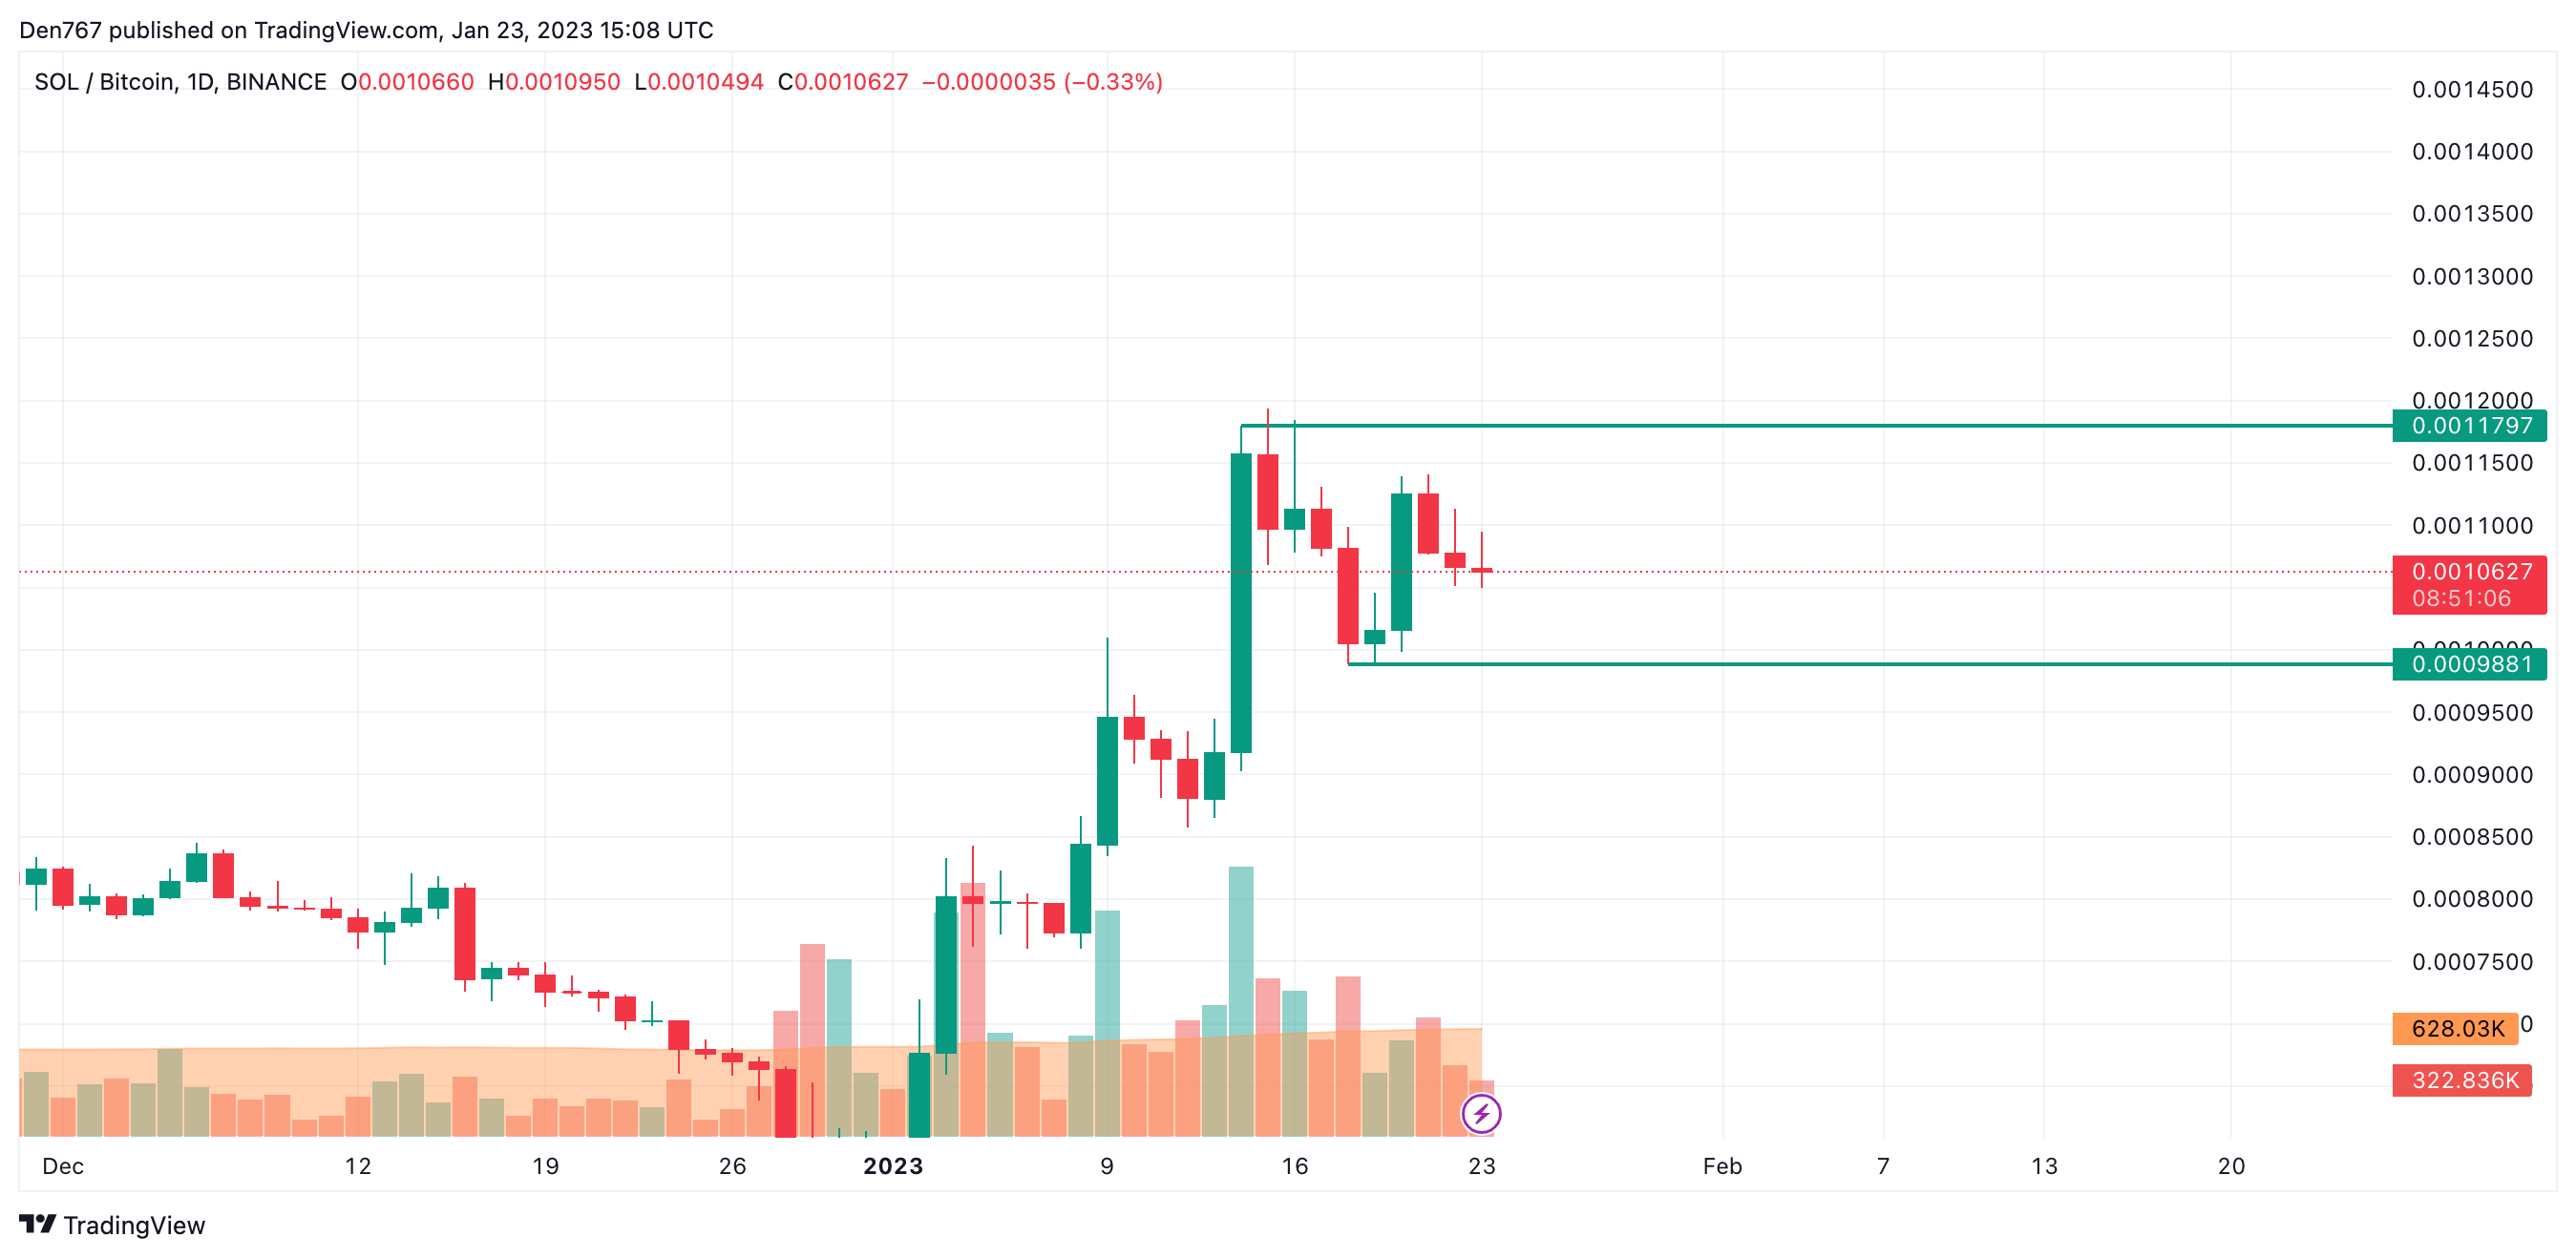
On the daily time frame against Bitcoin (BTC), Solana (SOL) is trading sideways as the price is located in the middle of the channel, between the support at 0.0009881 and the resistance at 0.0011797.
However, if bulls do not come back above the 0.0011 mark soon, the correction may continue to the 0.0010 mark.
SOL is trading at $24.28 at press time.