Ethereum
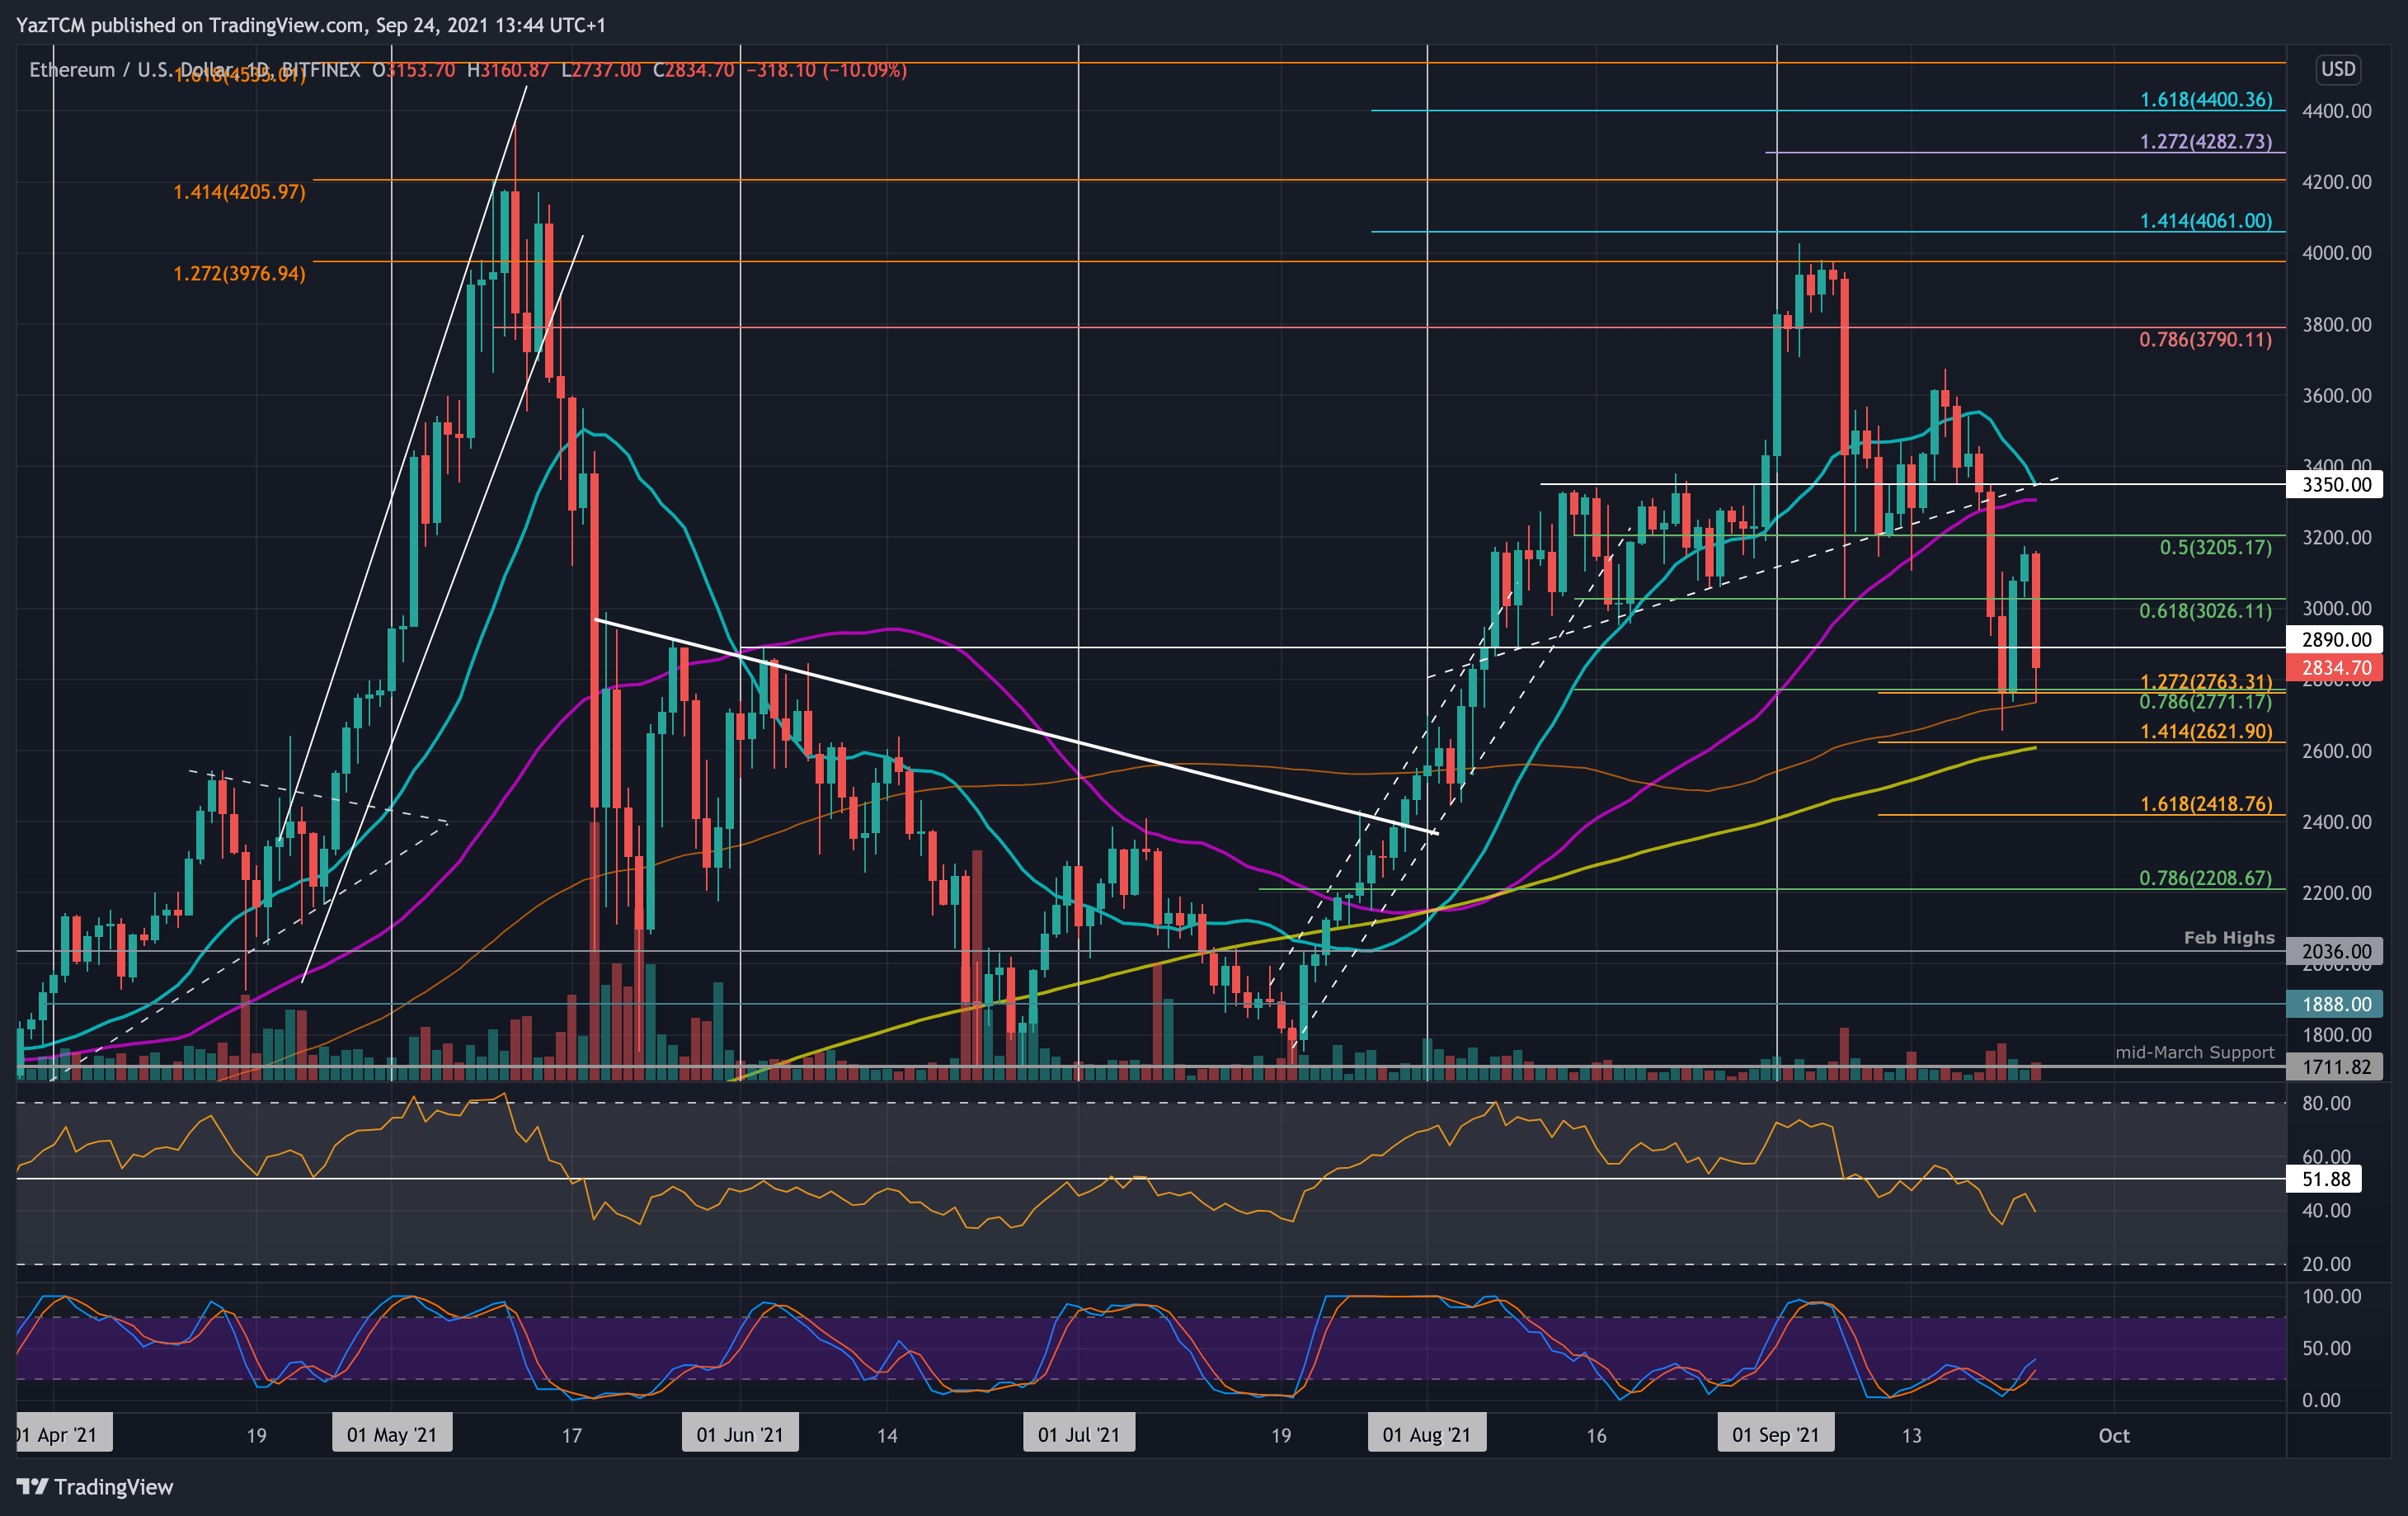
Ethereum is down a sharp 21% this week as the coin sits beneath $3000. The sell-off started on Monday when ETH slipped beneath the neckline of a head & shoulders pattern and the 50-day MA. Initially, the market found support at $3000 but would continue to fall beneath it on Tuesday to find support at $2770 (.786 Fib Retracement).
ETH did rebound on Wednesday and Thursday as it climbed back above $3000. However, it lost another sharp 9% today, causing it to break back beneath $3000 and reach the support at the 100-day MA at around $2730.
Looking ahead, if the sellers push lower, the first support lies between $2770 (.786 Fib) and $2730 (100-day MA). This is followed by $2600 (200-day MA), $2500, $2420 (downside 1.618 Fib Extension), and $2200 (.786 Fib).
On the other side, the first resistance lies at $2890. This is followed by $3000, $3200, $3350 (50-day MA & 20-day MA), and $3500.
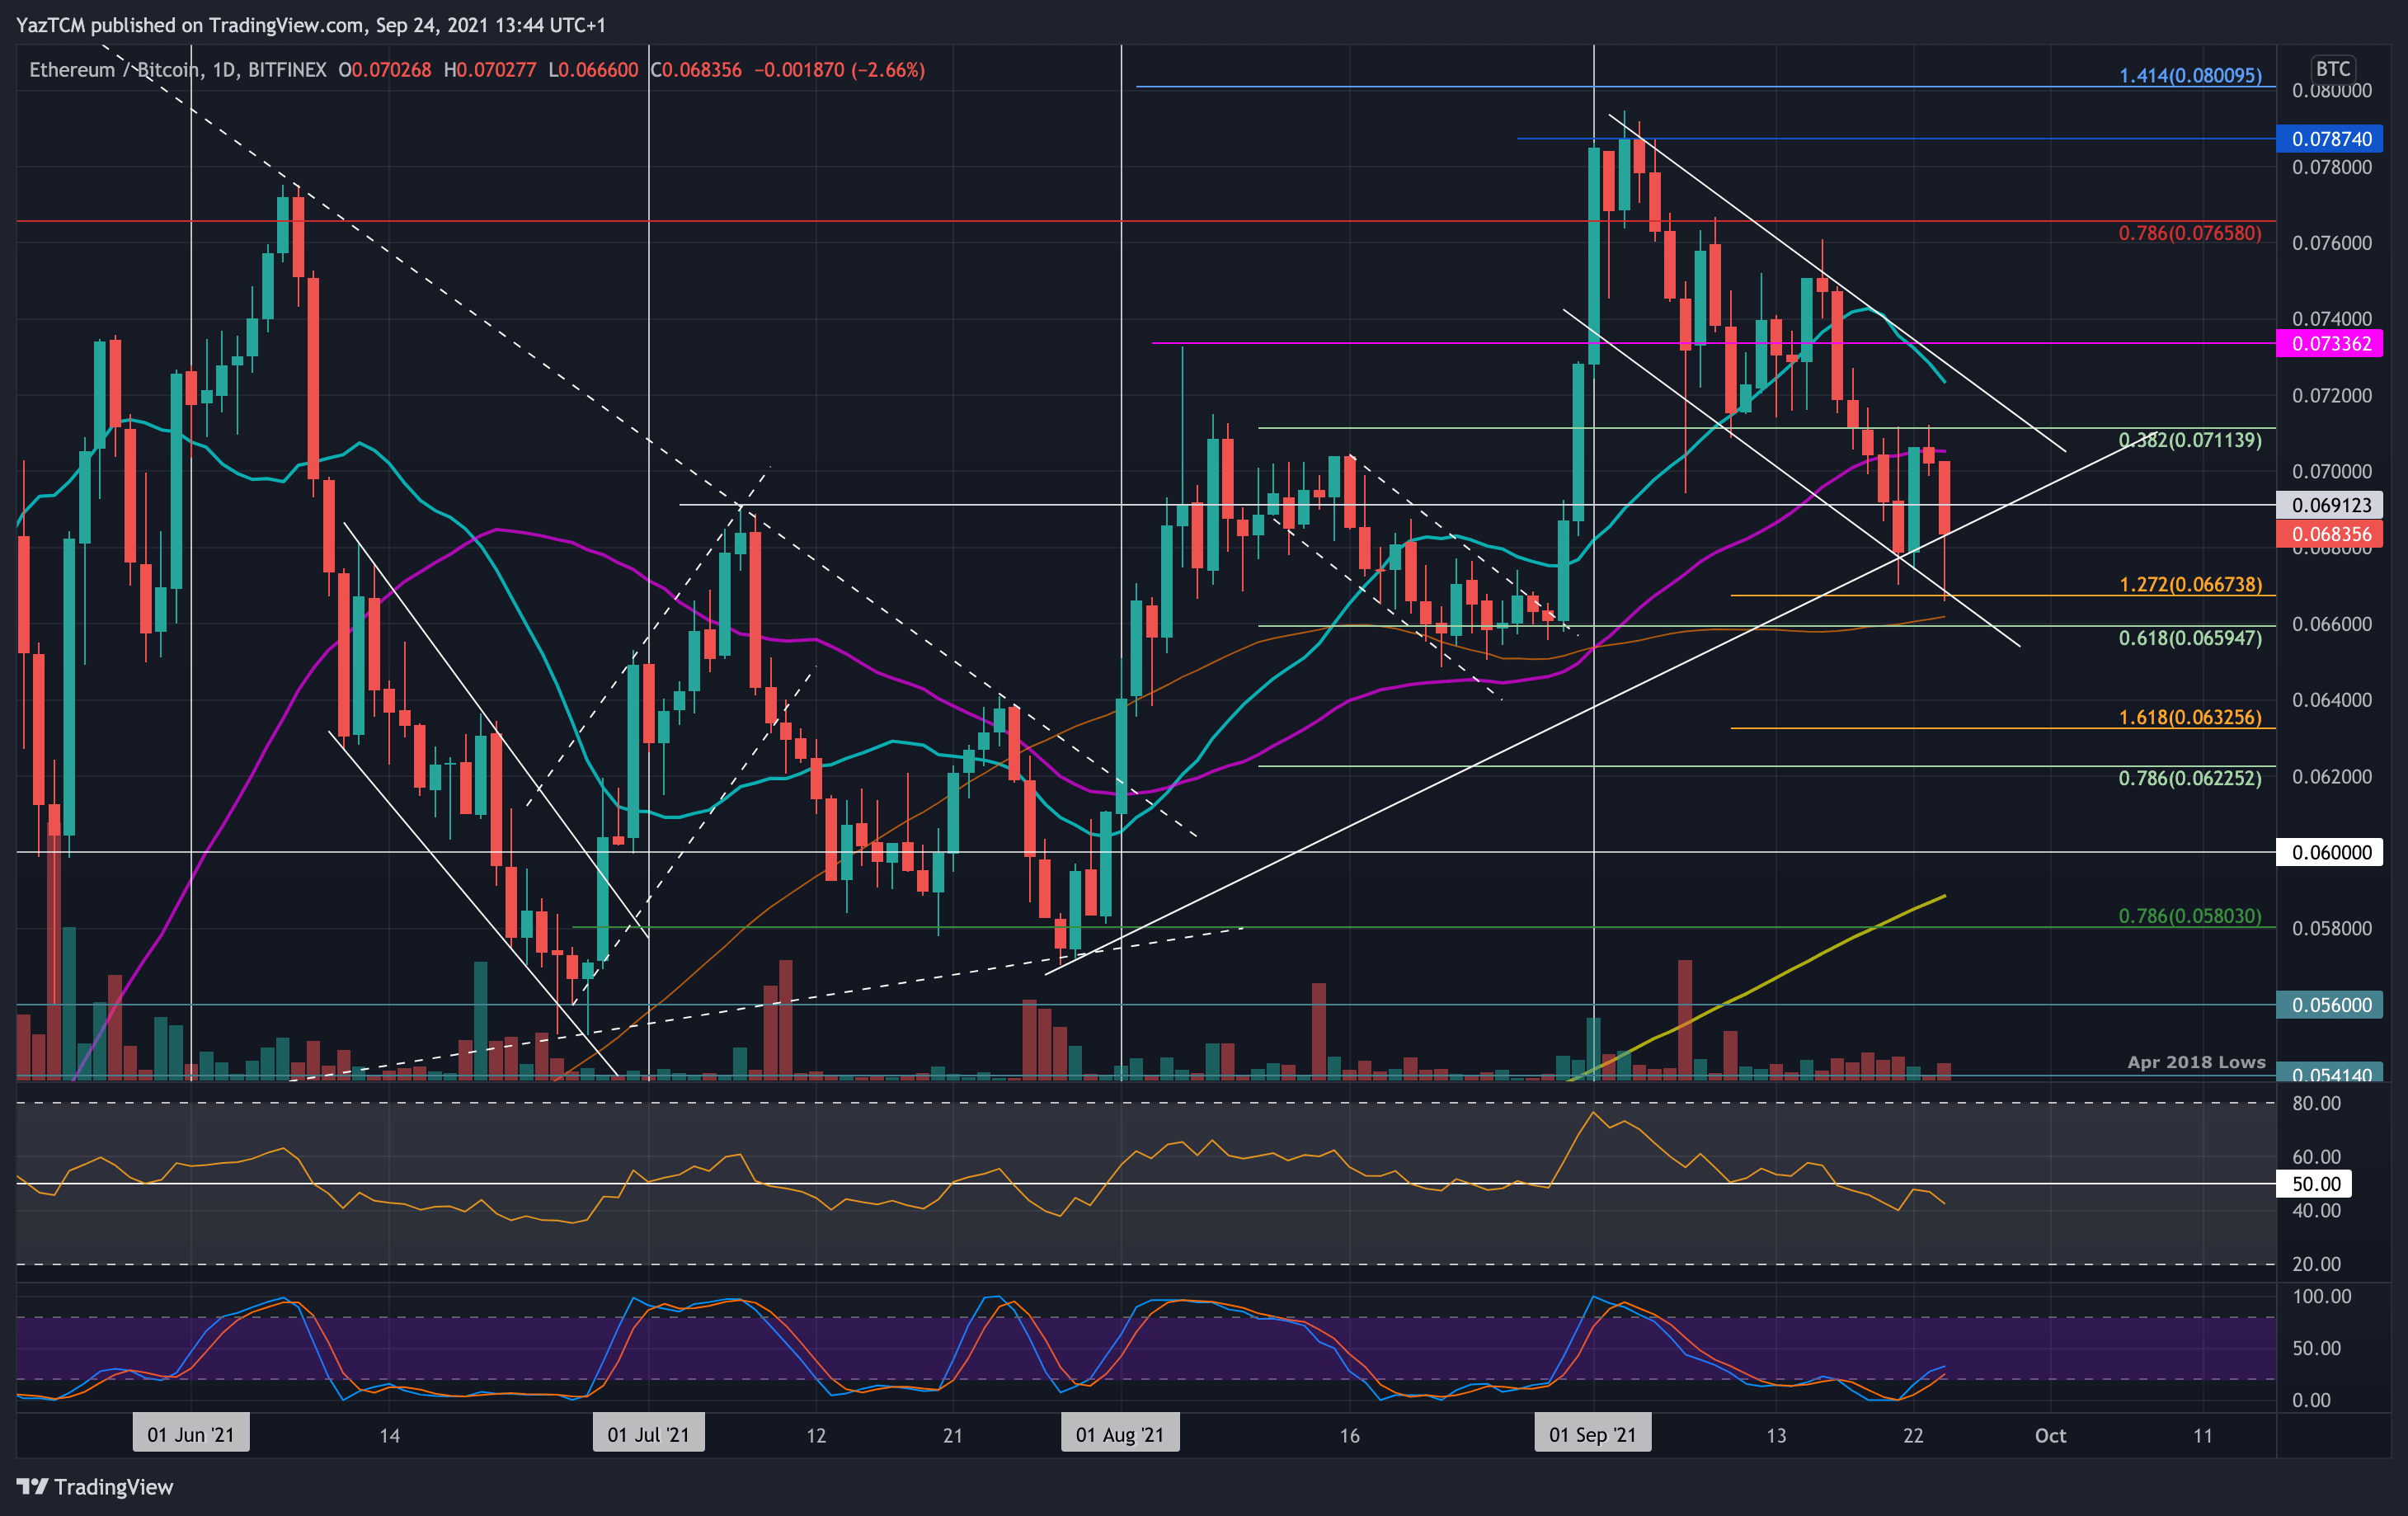
ETH is also struggling against BTC this week as it dropped as low as 0.0667 BTC (downside 1.272 Fib Extension) today. The cryptocurrency fell beneath the 50-day MA and 0.07 BTC on Monday as it continued to slide until support was met at 0.068 BTC. The level there was bolstered by a rising trend line that allowed ETH to rebound on Wednesday.
Unfortunately, ETH was unable to overcome the resistance at the 50-day MA and fell from there today to reach as low as 0.0667 BTC. It has since bounced and is trading above the rising trend line.
Looking ahead, if the sellers break the trend line and fall beneath 0.068 BTC, the first solid support lies at 0.0667 BTC. This is followed by 0.066 BTC (.618 Fib & 100-day MA), 0.065 BTC, 0.064 BTC, and 0.0632 BTC (downside 1.618 Fib Extension).
On the other side, the first resistance lies at 0.0691 BTC. This is followed by 0.07 BTC (50-day MA), 0.0711 BTC, and 0.072 BTC.
Ripple
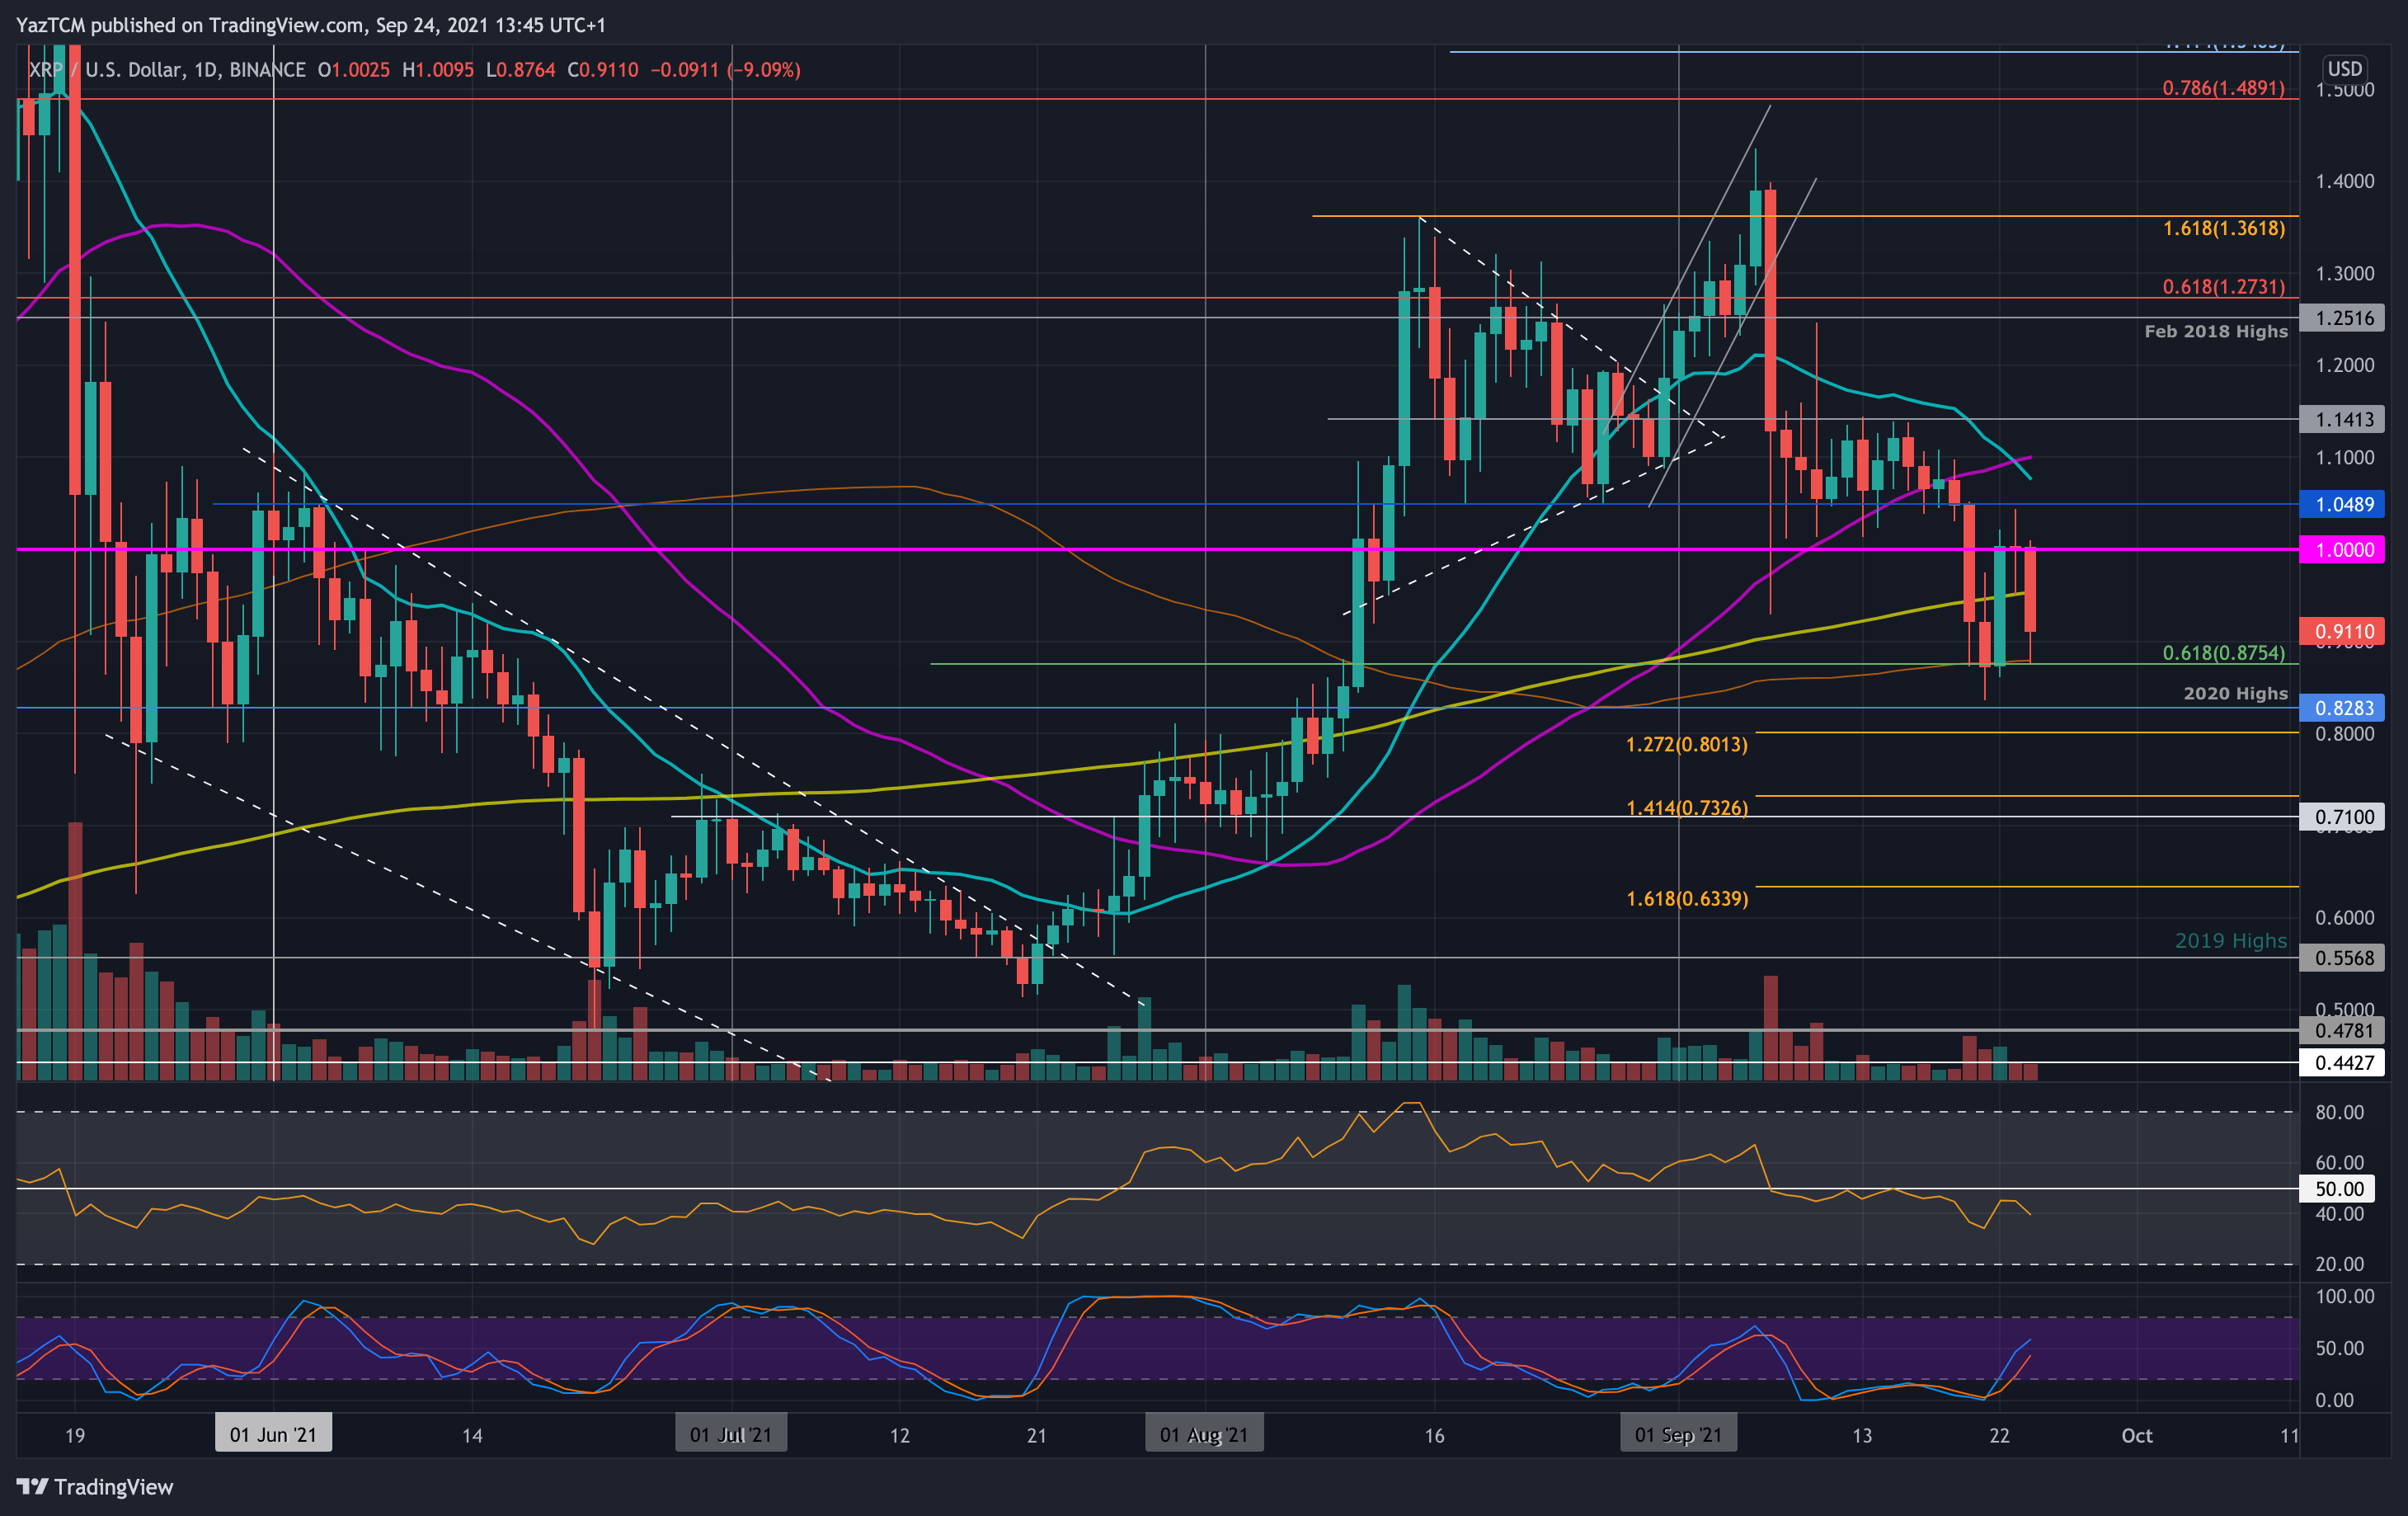
XRP dropped by a steep 17% this week as it falls back beneath $1. XRP dropped below the 50-day MA on Sunday and continued on Monday as it lost the 200-day MA until it found support at $0.875 (.618 Fib & 100-day MA).
XRP held $0.875 on Tuesday and rebounded from there on Wednesday to return to $1. Unfortunately, the buyers could not break this level and fell from there today to return to the 100-day MA support.
Looking ahead, if the bears push beneath the 100-day MA, the first support lies at $0.8282 (2020 highs). This is followed by $0.8 (downside 1.272 Fib Extension), $0.732 (downside 1.414 Fib Extension), $0.7, and $0.65.
On the other side, the first resistance lies at $0.95 (200-day MA). This is followed by $1, $1.05, and $1.10 (50-day MA).
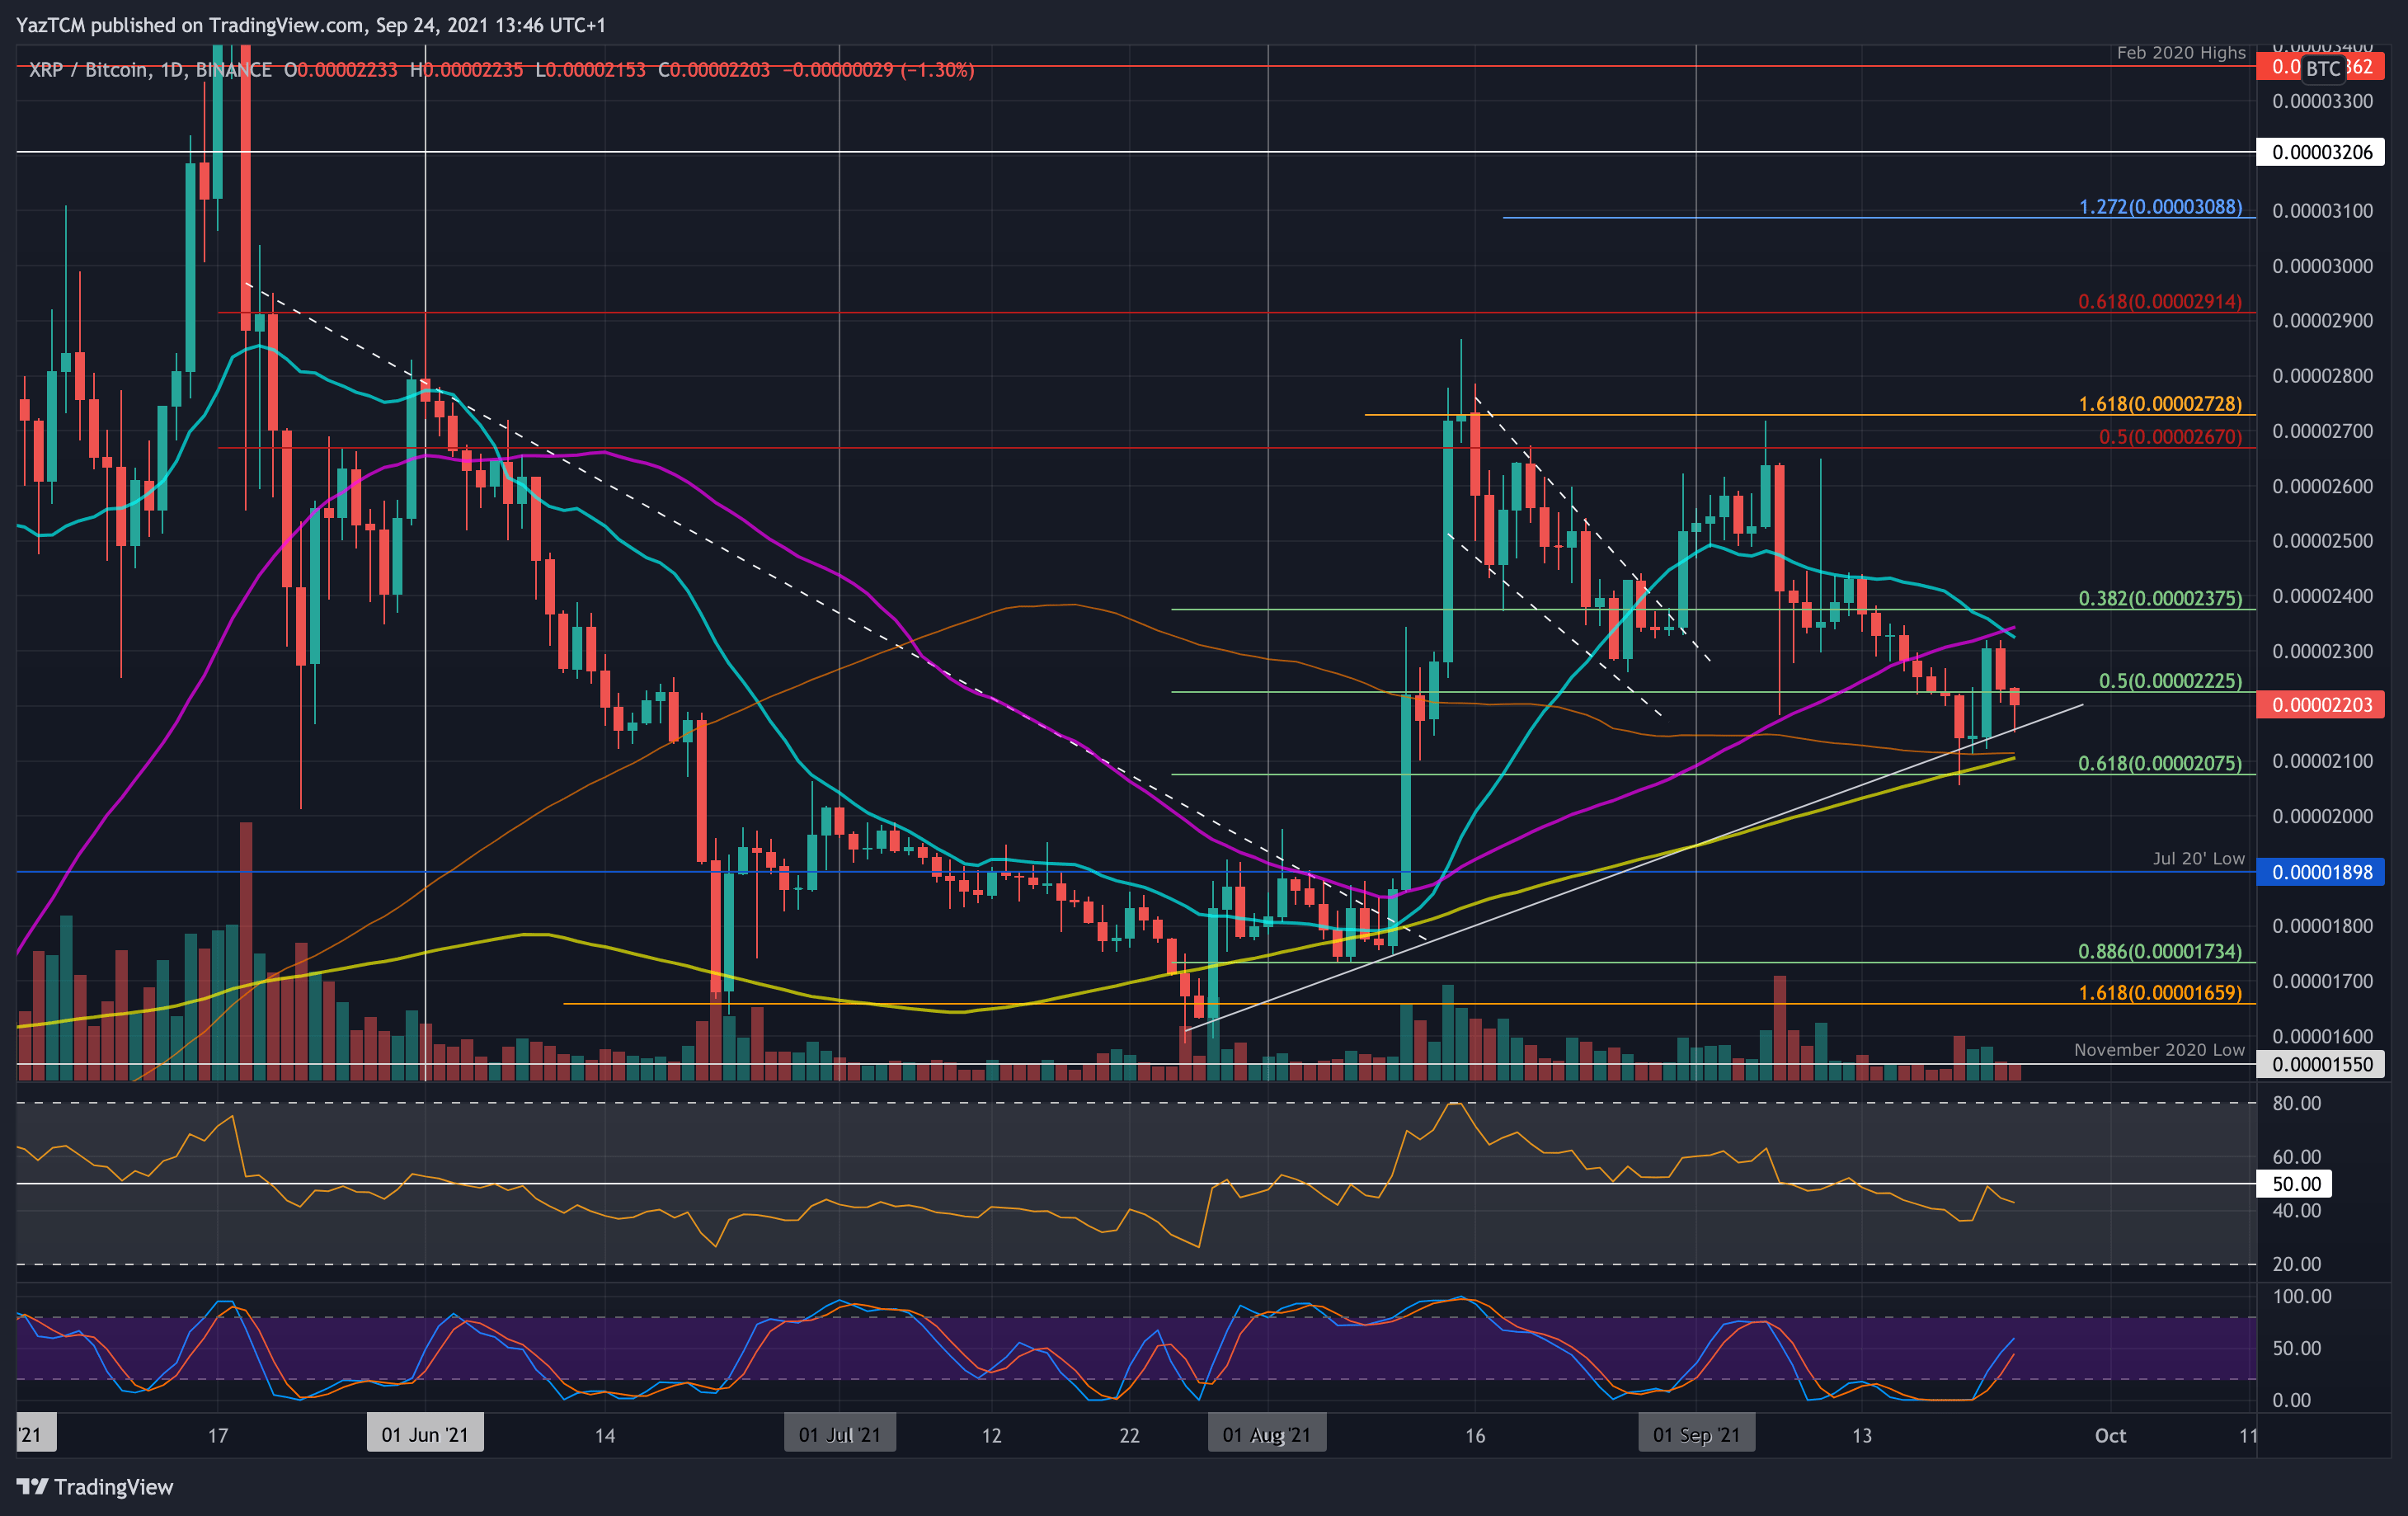
XRP is also in a bearish battle against BTC as it sits above 2200 SAT. On Monday, XRP fell beneath 2225 SAT (.5 Fib) and spiked as low as 2050 SAT (.618 Fib). More specifically, the coin found support at a rising trend line and rebounded from there on Wednesday.
It managed to reach as high as 2300 SAT and reversed from there yesterday. Today, XRP fell beneath 2200 SAT but found support at the rising trend line. It is still above the weekly low, which is a very promising sign.
Looking ahead, if the bears push beneath the rising trend line, the first support lies at 2100 SAT (200-day MA & 100-day MA). This is followed by 2075 SAT (.618 Fib), 2000 SAT, 1900 SAT (July 2020 low), and 1735 SAT (.886 Fib).
On the other side, resistance is first expected at 2300 SAT. This is followed by 2350 SAT (50-day MA), 2400 SAT, and 2500 SAT.
Cardano
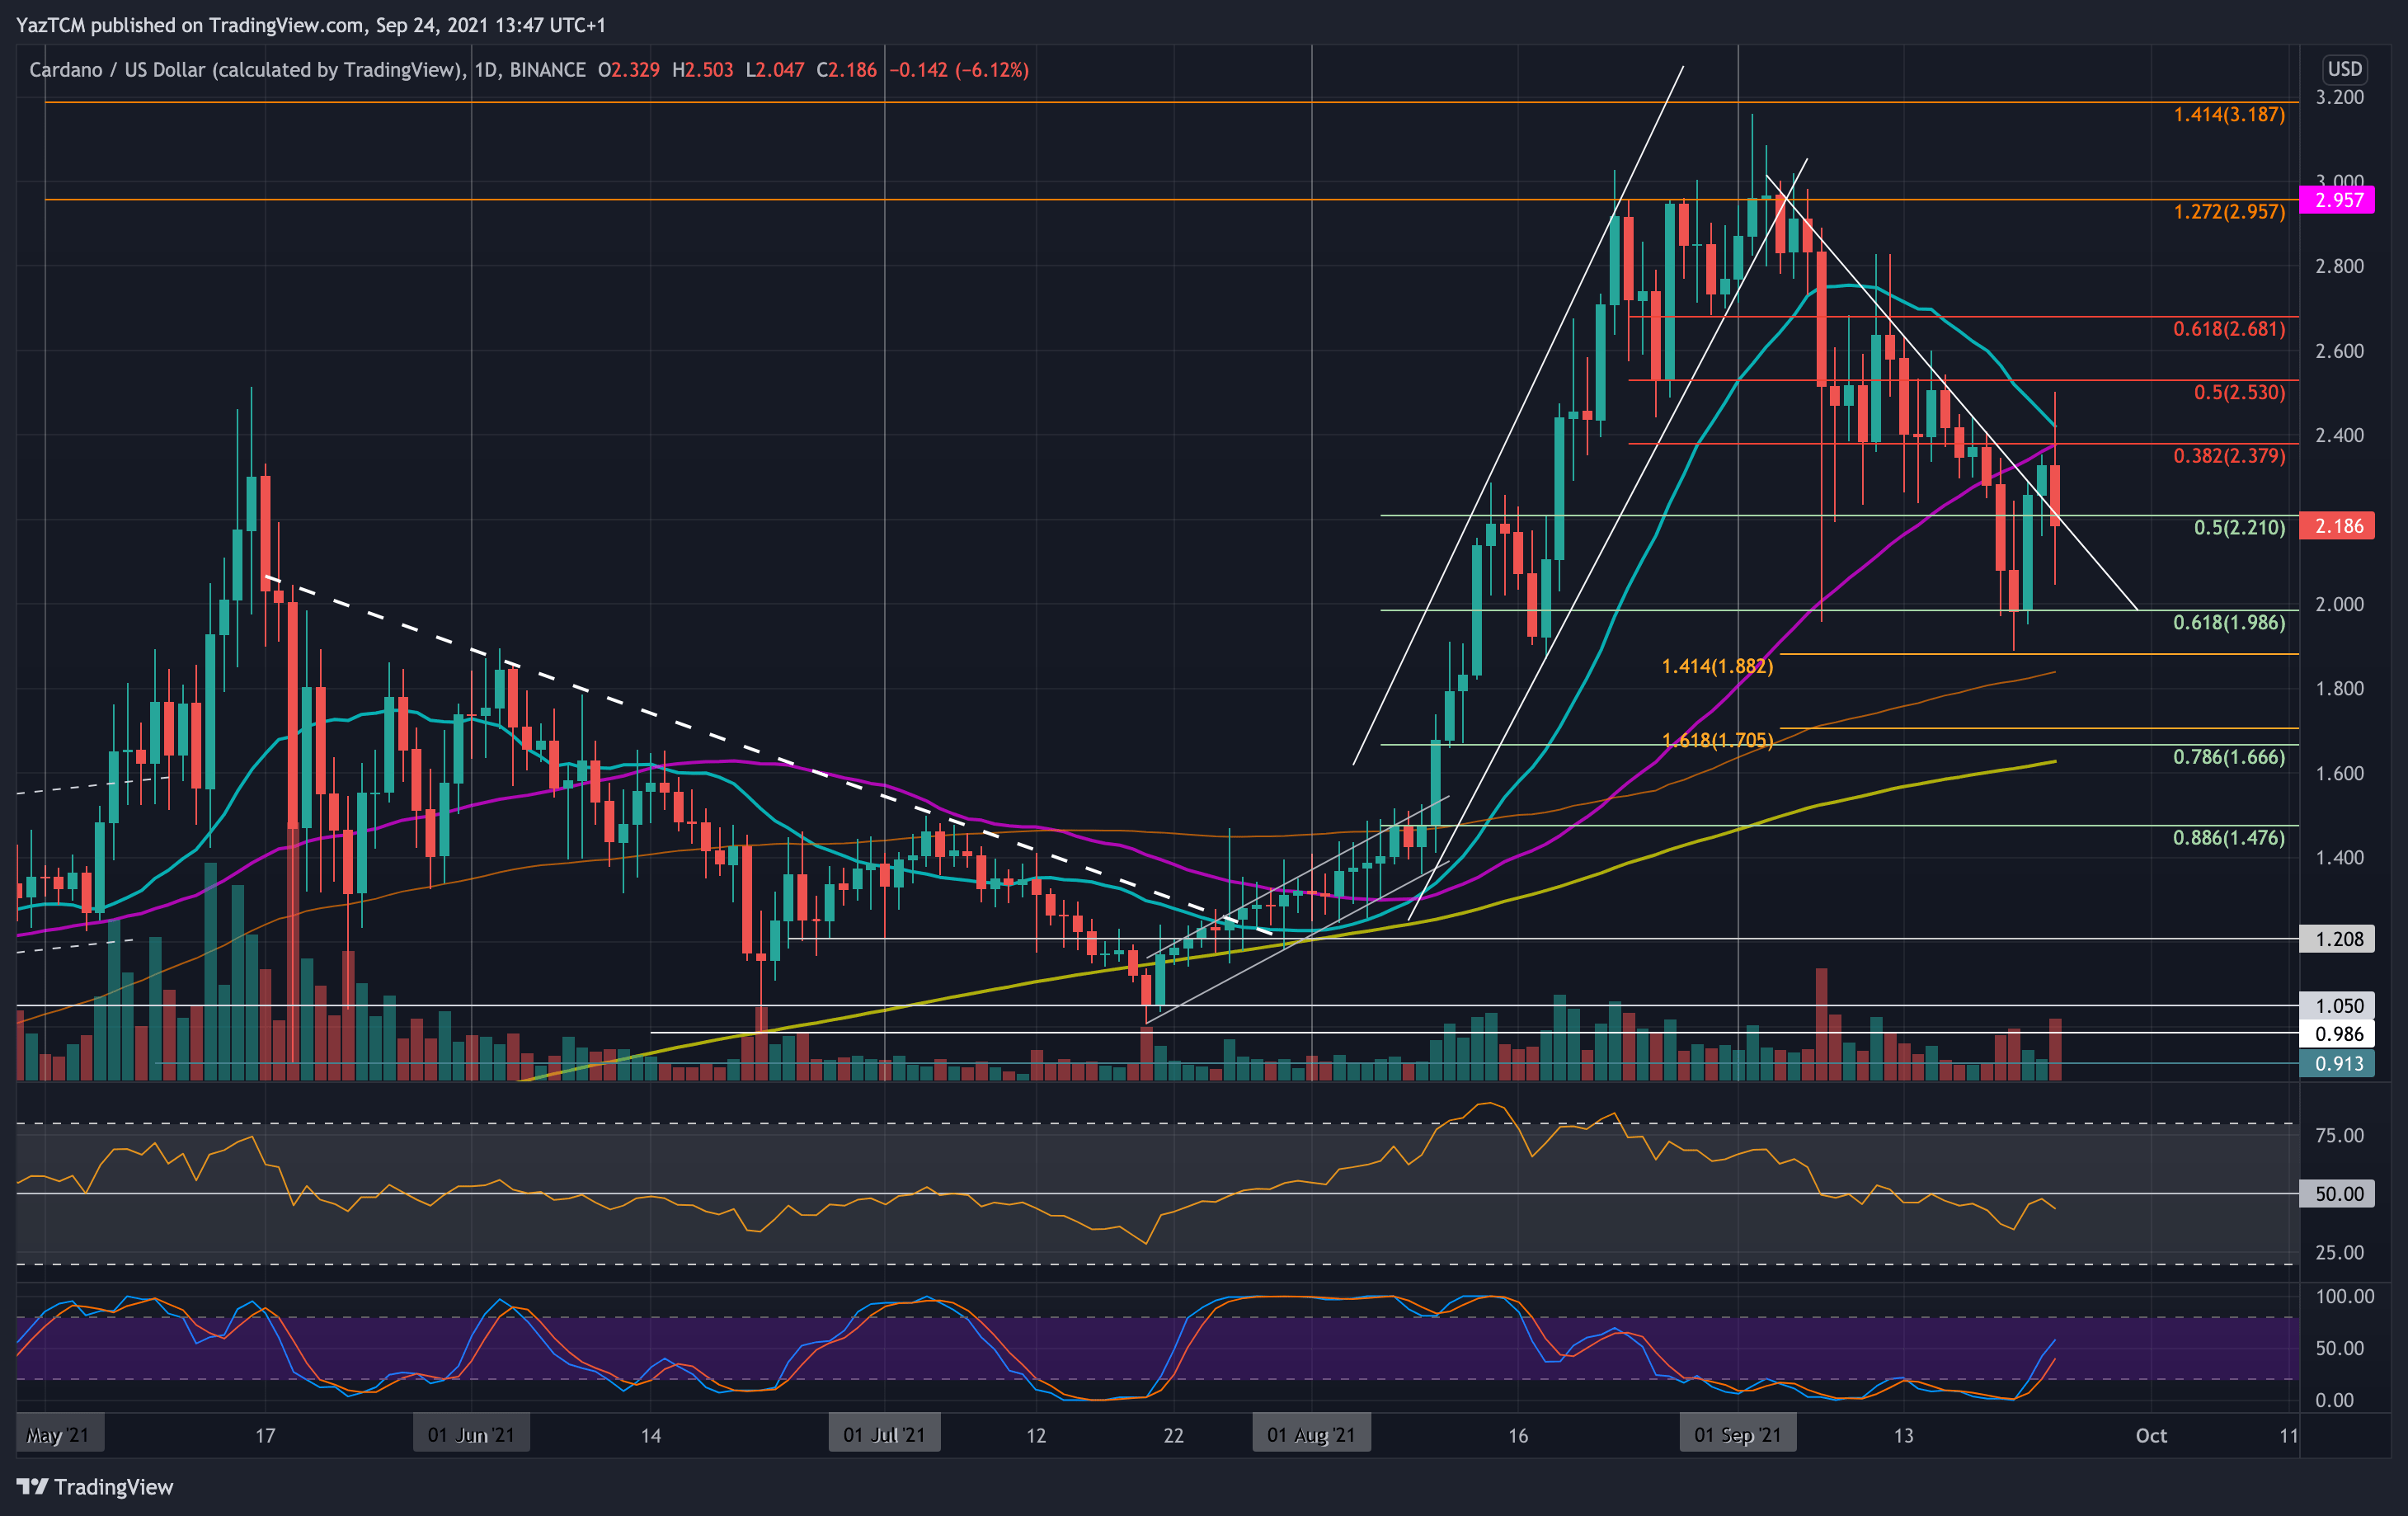
ADA fell by a small 11% this week as the coin currently sits at $2.18. It also dropped beneath the 50-day MA on Monday and continued to slip until support was found at $1.88 (downside 1.414 Fib Extension) on Tuesday.
More specifically, ADA found support at $2.00 (.618 Fib Retracement) and rebounded from there on Wednesday.
Yesterday, ADA briefly crossed a falling trend line to reach the resistance at the 50-day MA. It continued to spike as high as $2.50 earlier today but has since dropped back beneath $2.20.
Looking ahead, the first strong support lies at $2.00 (.618 Fib). This is followed by $1.88 (downside 1.414 Fib Extension), $1.80 (100-day MA), and $1.66 (.786 Fib).
On the other side, the first resistance lies at $2.40 (bearish .382 Fib & 50-day MA). This is followed by $2.53 (bearish .5 Fib), $2.68 (.bearish .618 Fib), and $2.80.
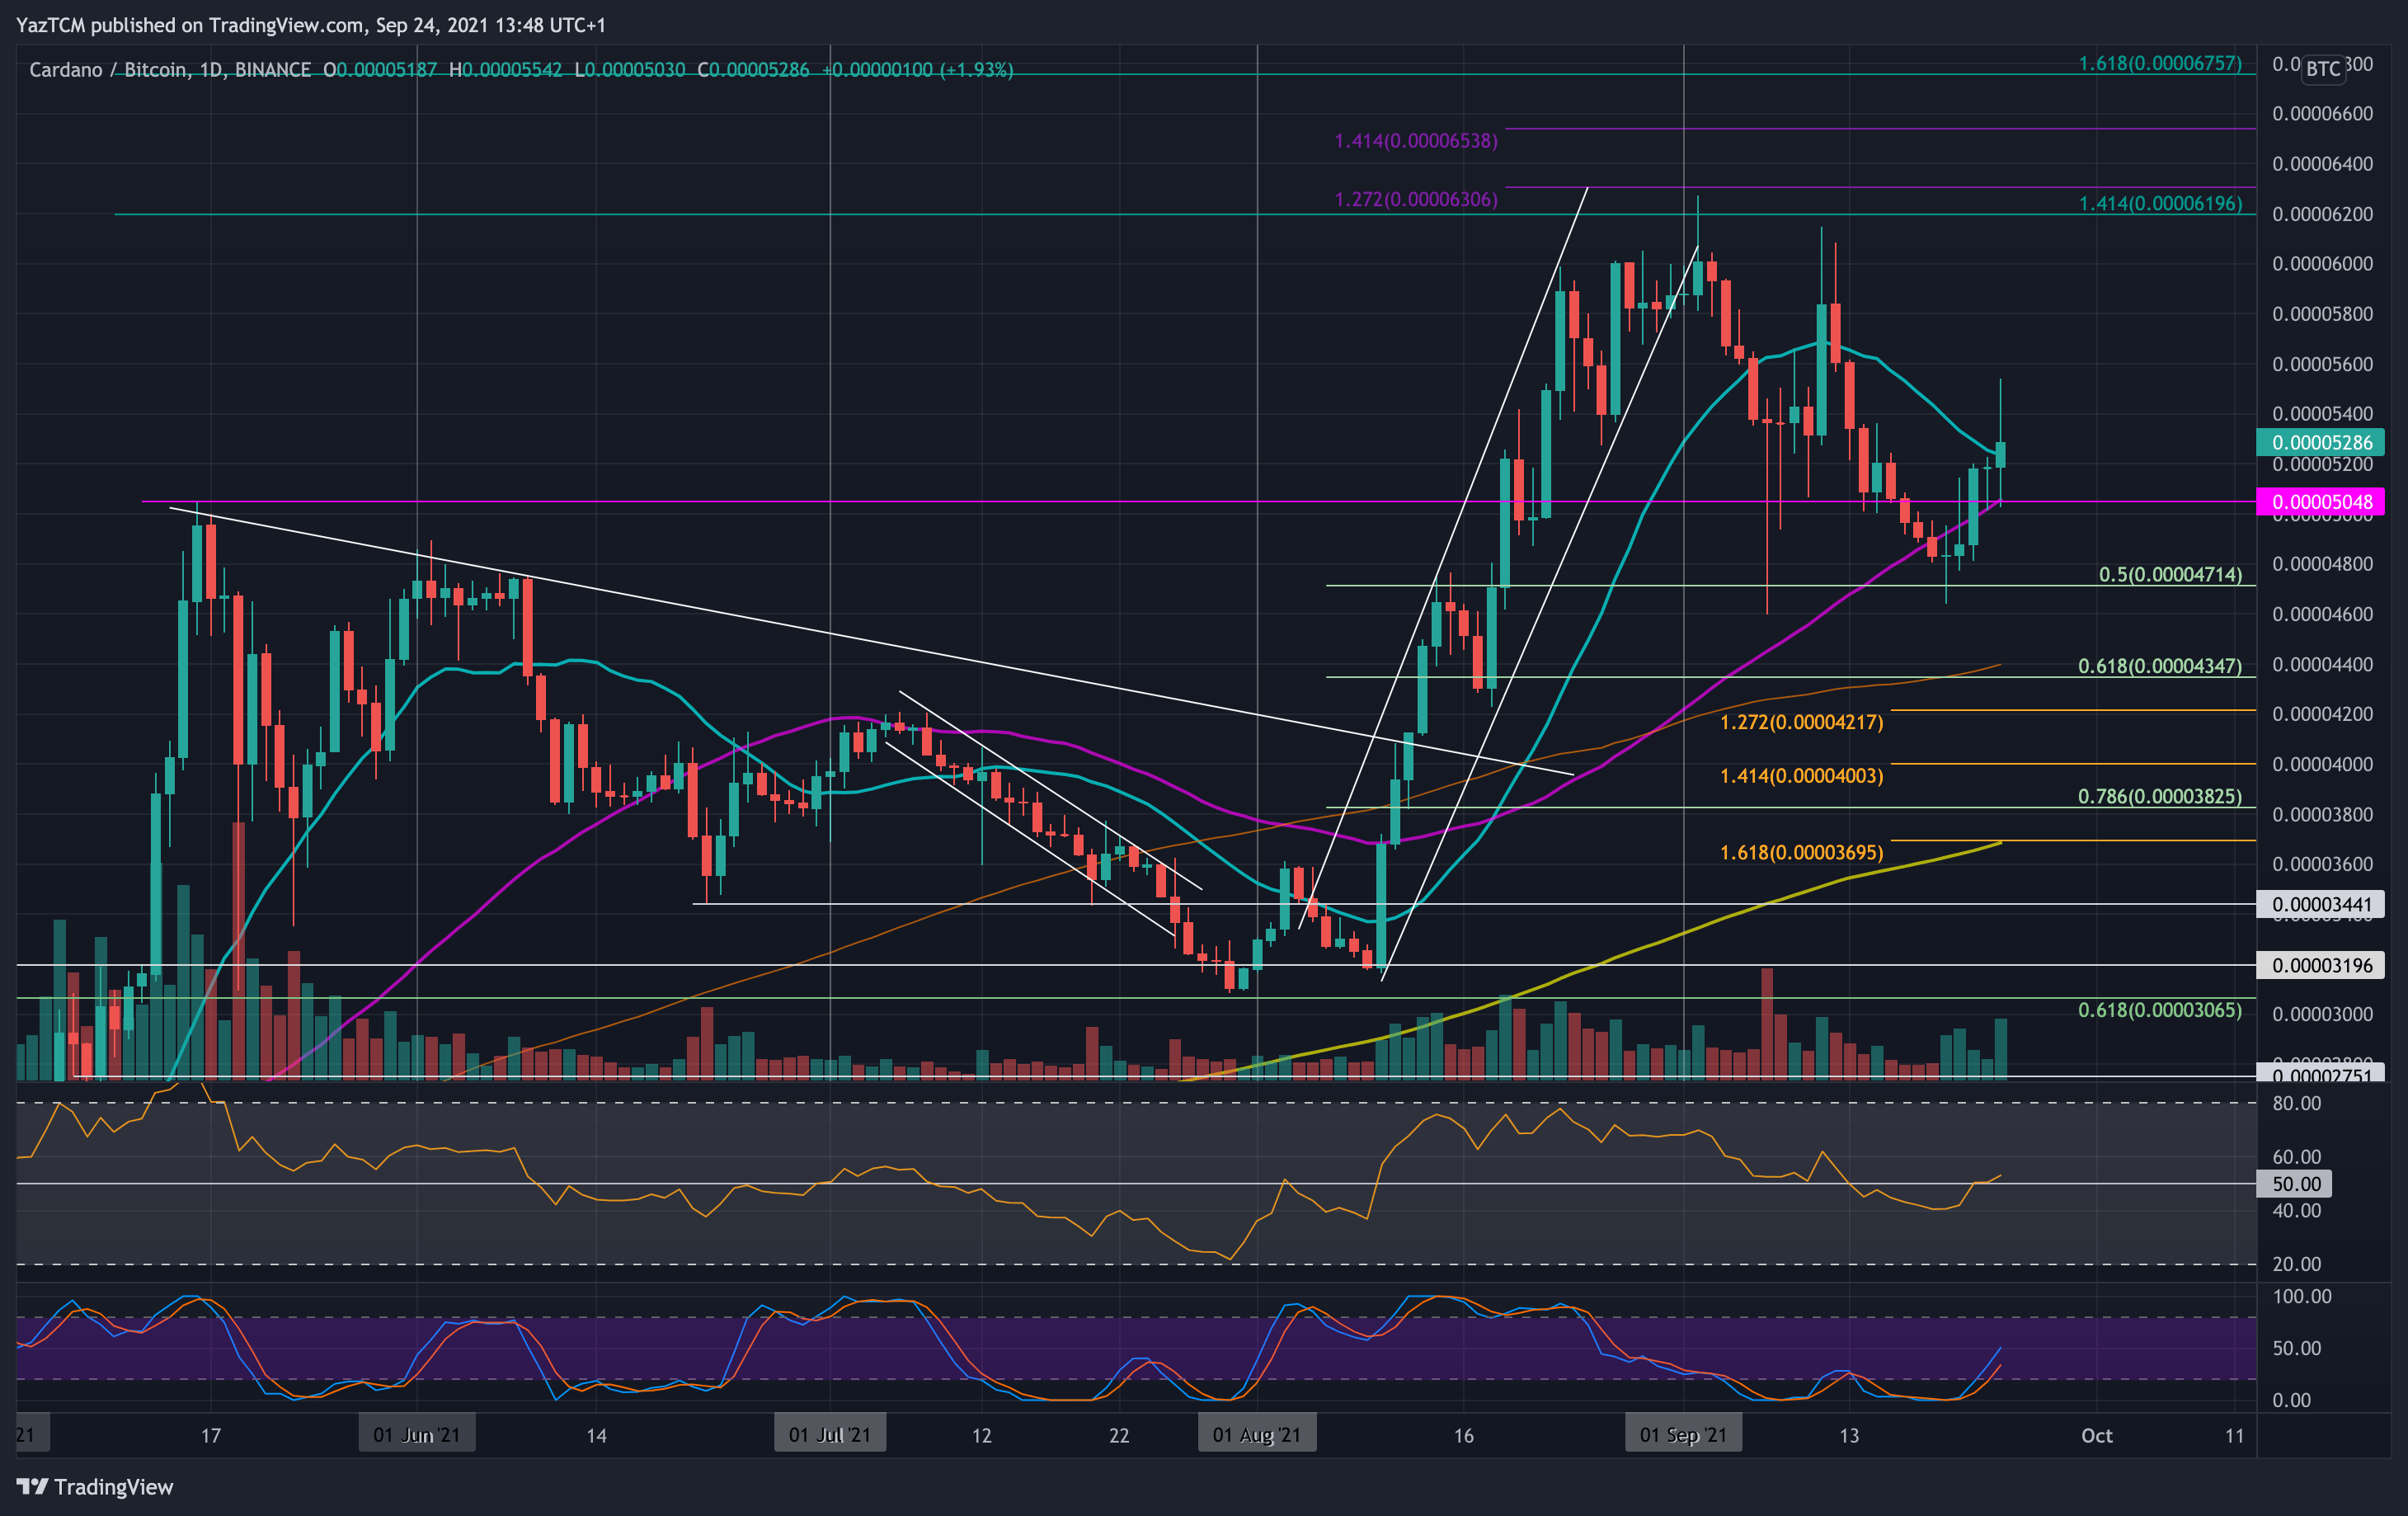
ADA is attempting to recover against BTC as it sits above 5200 SAT. The coin found solid support at 4800 SAT on Monday and managed to hold it during the entire week.
On Wednesday, ADA finally surged back above the 50-day MA and continued higher above 5000 SAT. It broke the 20-day MA at 5200 SAT today and reached above 5500 SAT.
Looking ahead, the first support lies at 5000 SAT (50-day MA). This is followed by 4800 SAT, 4715 SAT (.5 Fib), 4600 SAT, and 4400 SAT (100-day MA).
On the other side, the first resistance lies at 5600 SAT. This is followed by 5800 SAT, 6000 SAT, and 6200 SAT.
Solana
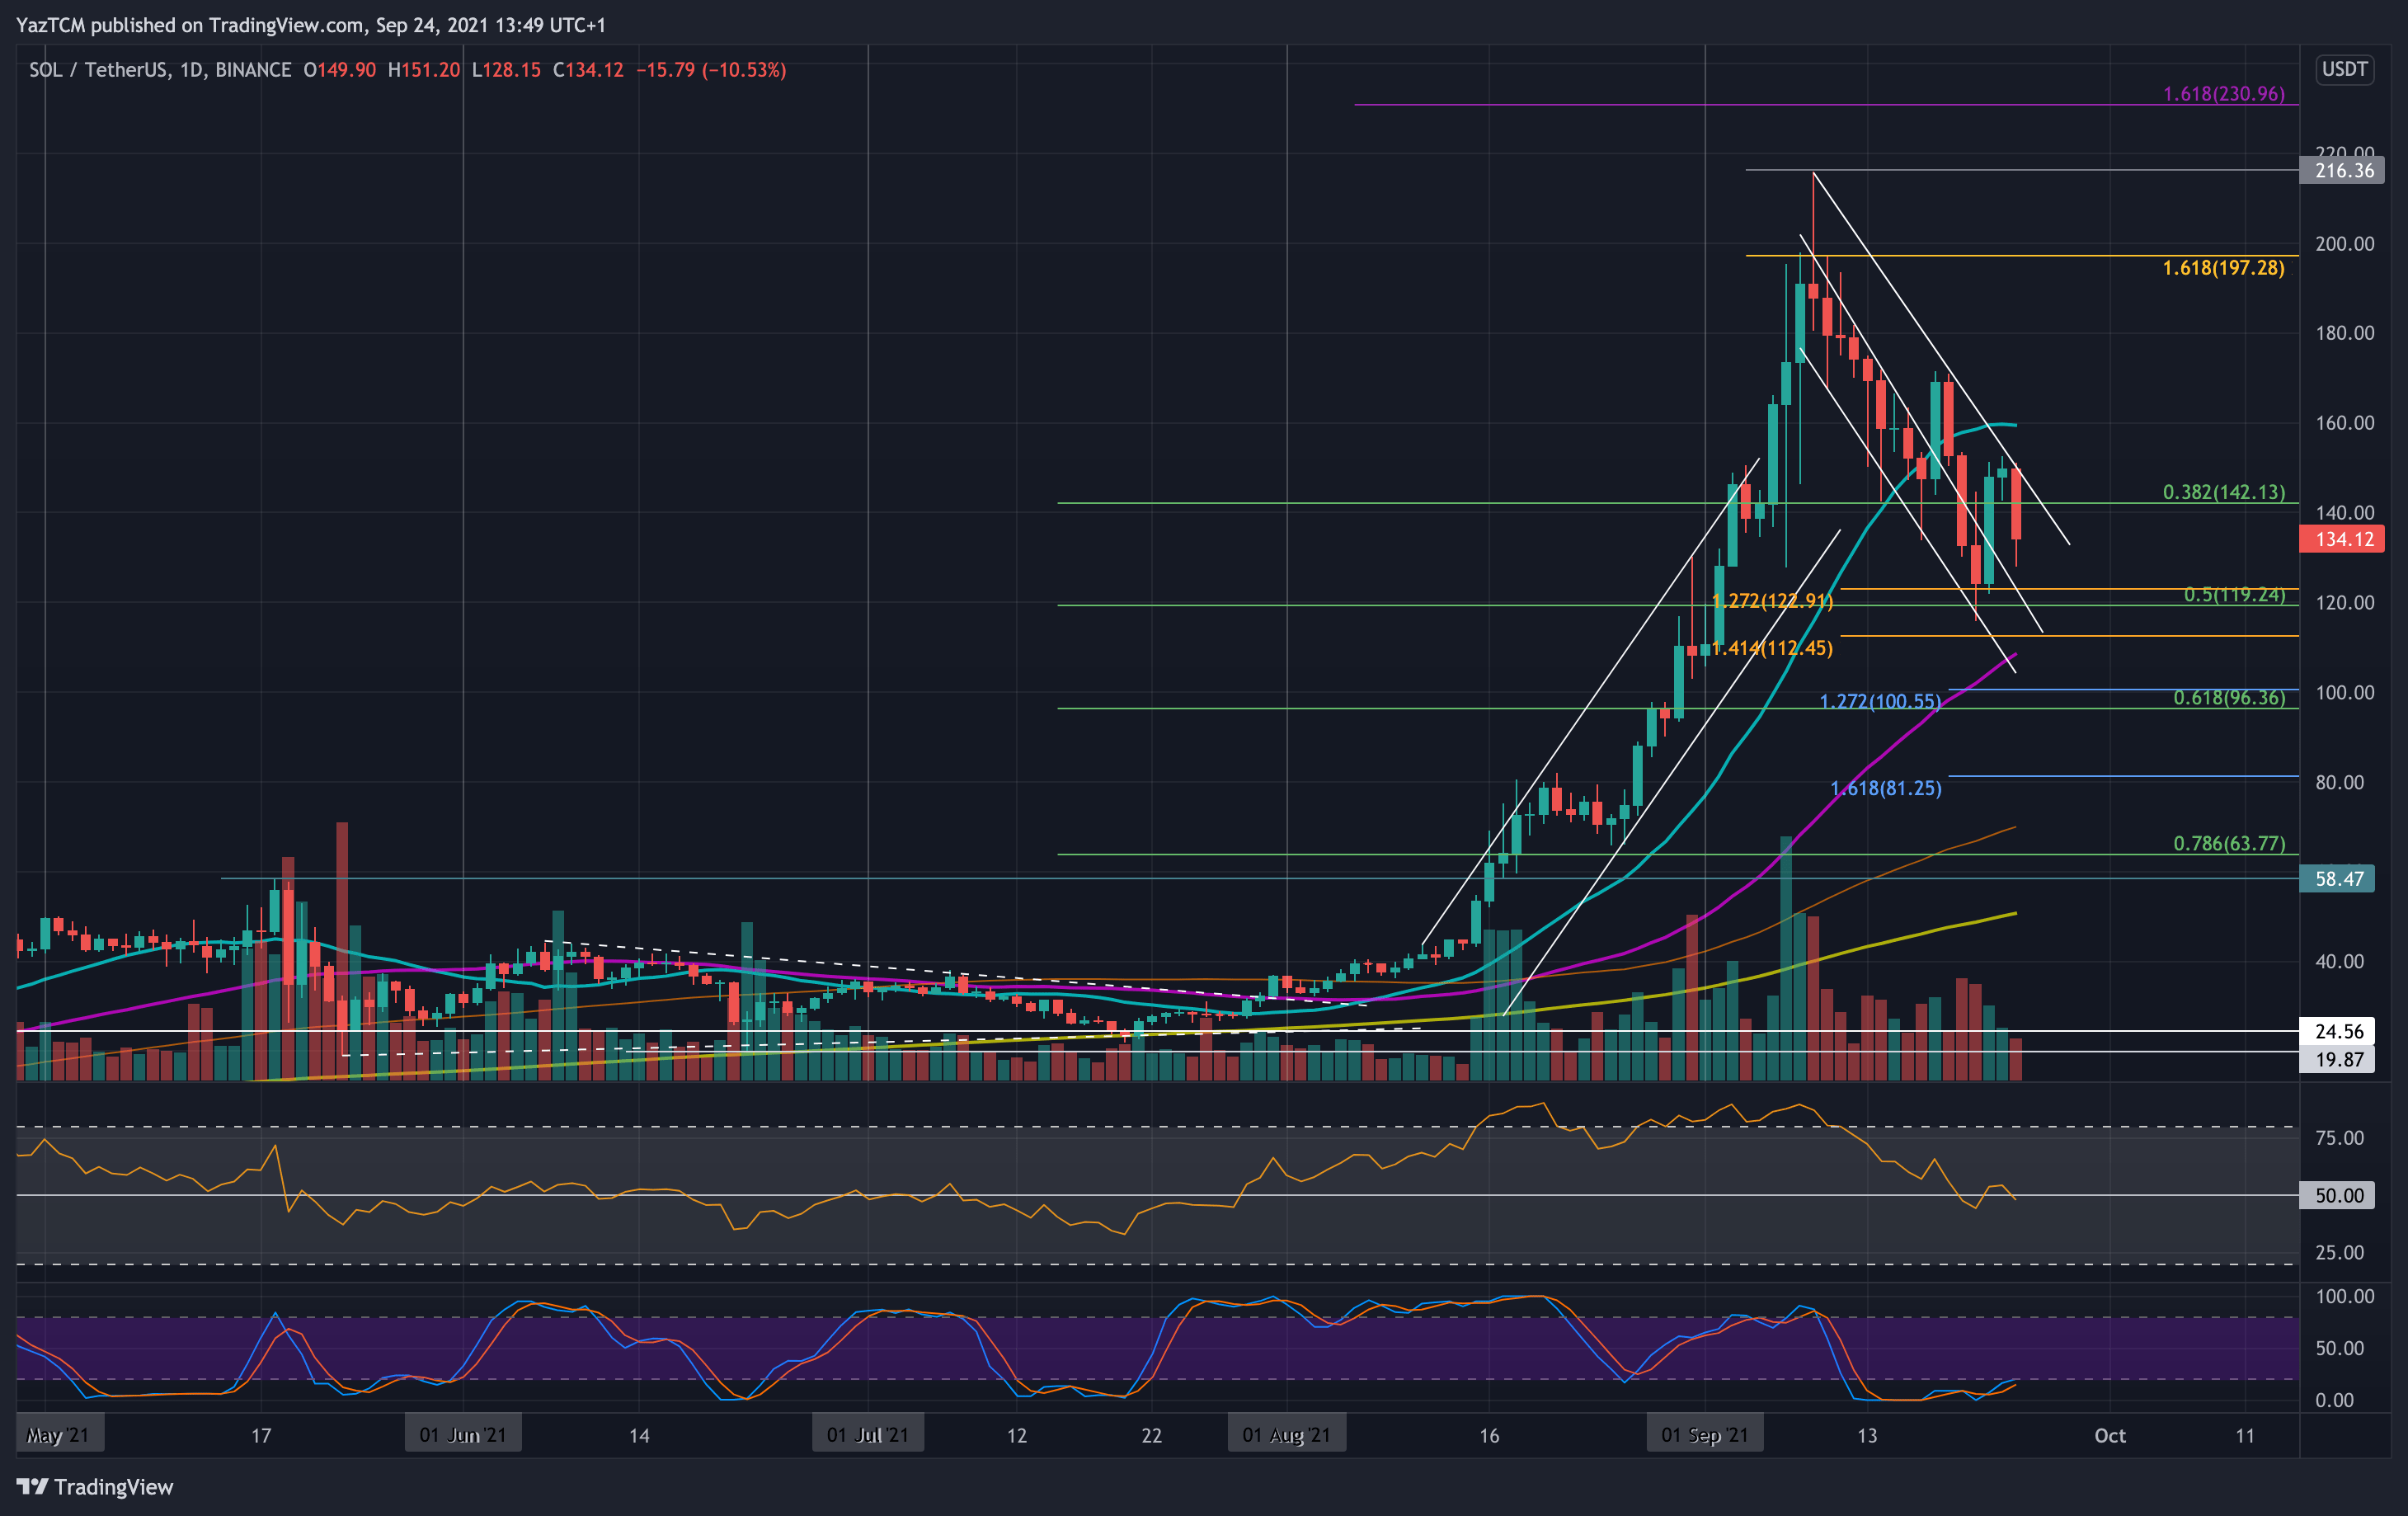
SOL is down a steep 13% this week as the coin currently trades around $135. The cryptocurrency has been trading inside a descending price channel since the first week of September and must break the boundary to end the current negative trend.
SOL dropped beneath $140 on Monday and continued lower until support was found at $123 (downside 1.272 Fib Extension) on Tuesday. It rebounded from there on Wednesday but rolled over today after meeting resistance at the upper angle of the price channel.
Looking ahead, the first support lies at $123 (downside 1.272 Fib Extension). This is followed by $119 (.5 Fib Retracement), $112 (downside 1.414 Fib Extension), $110 (50-day MA), and $100.
On the other side, the first resistance lies at $150 (upper angle of the price channel). This is followed by $160 (20-day MA), $180, and $200.
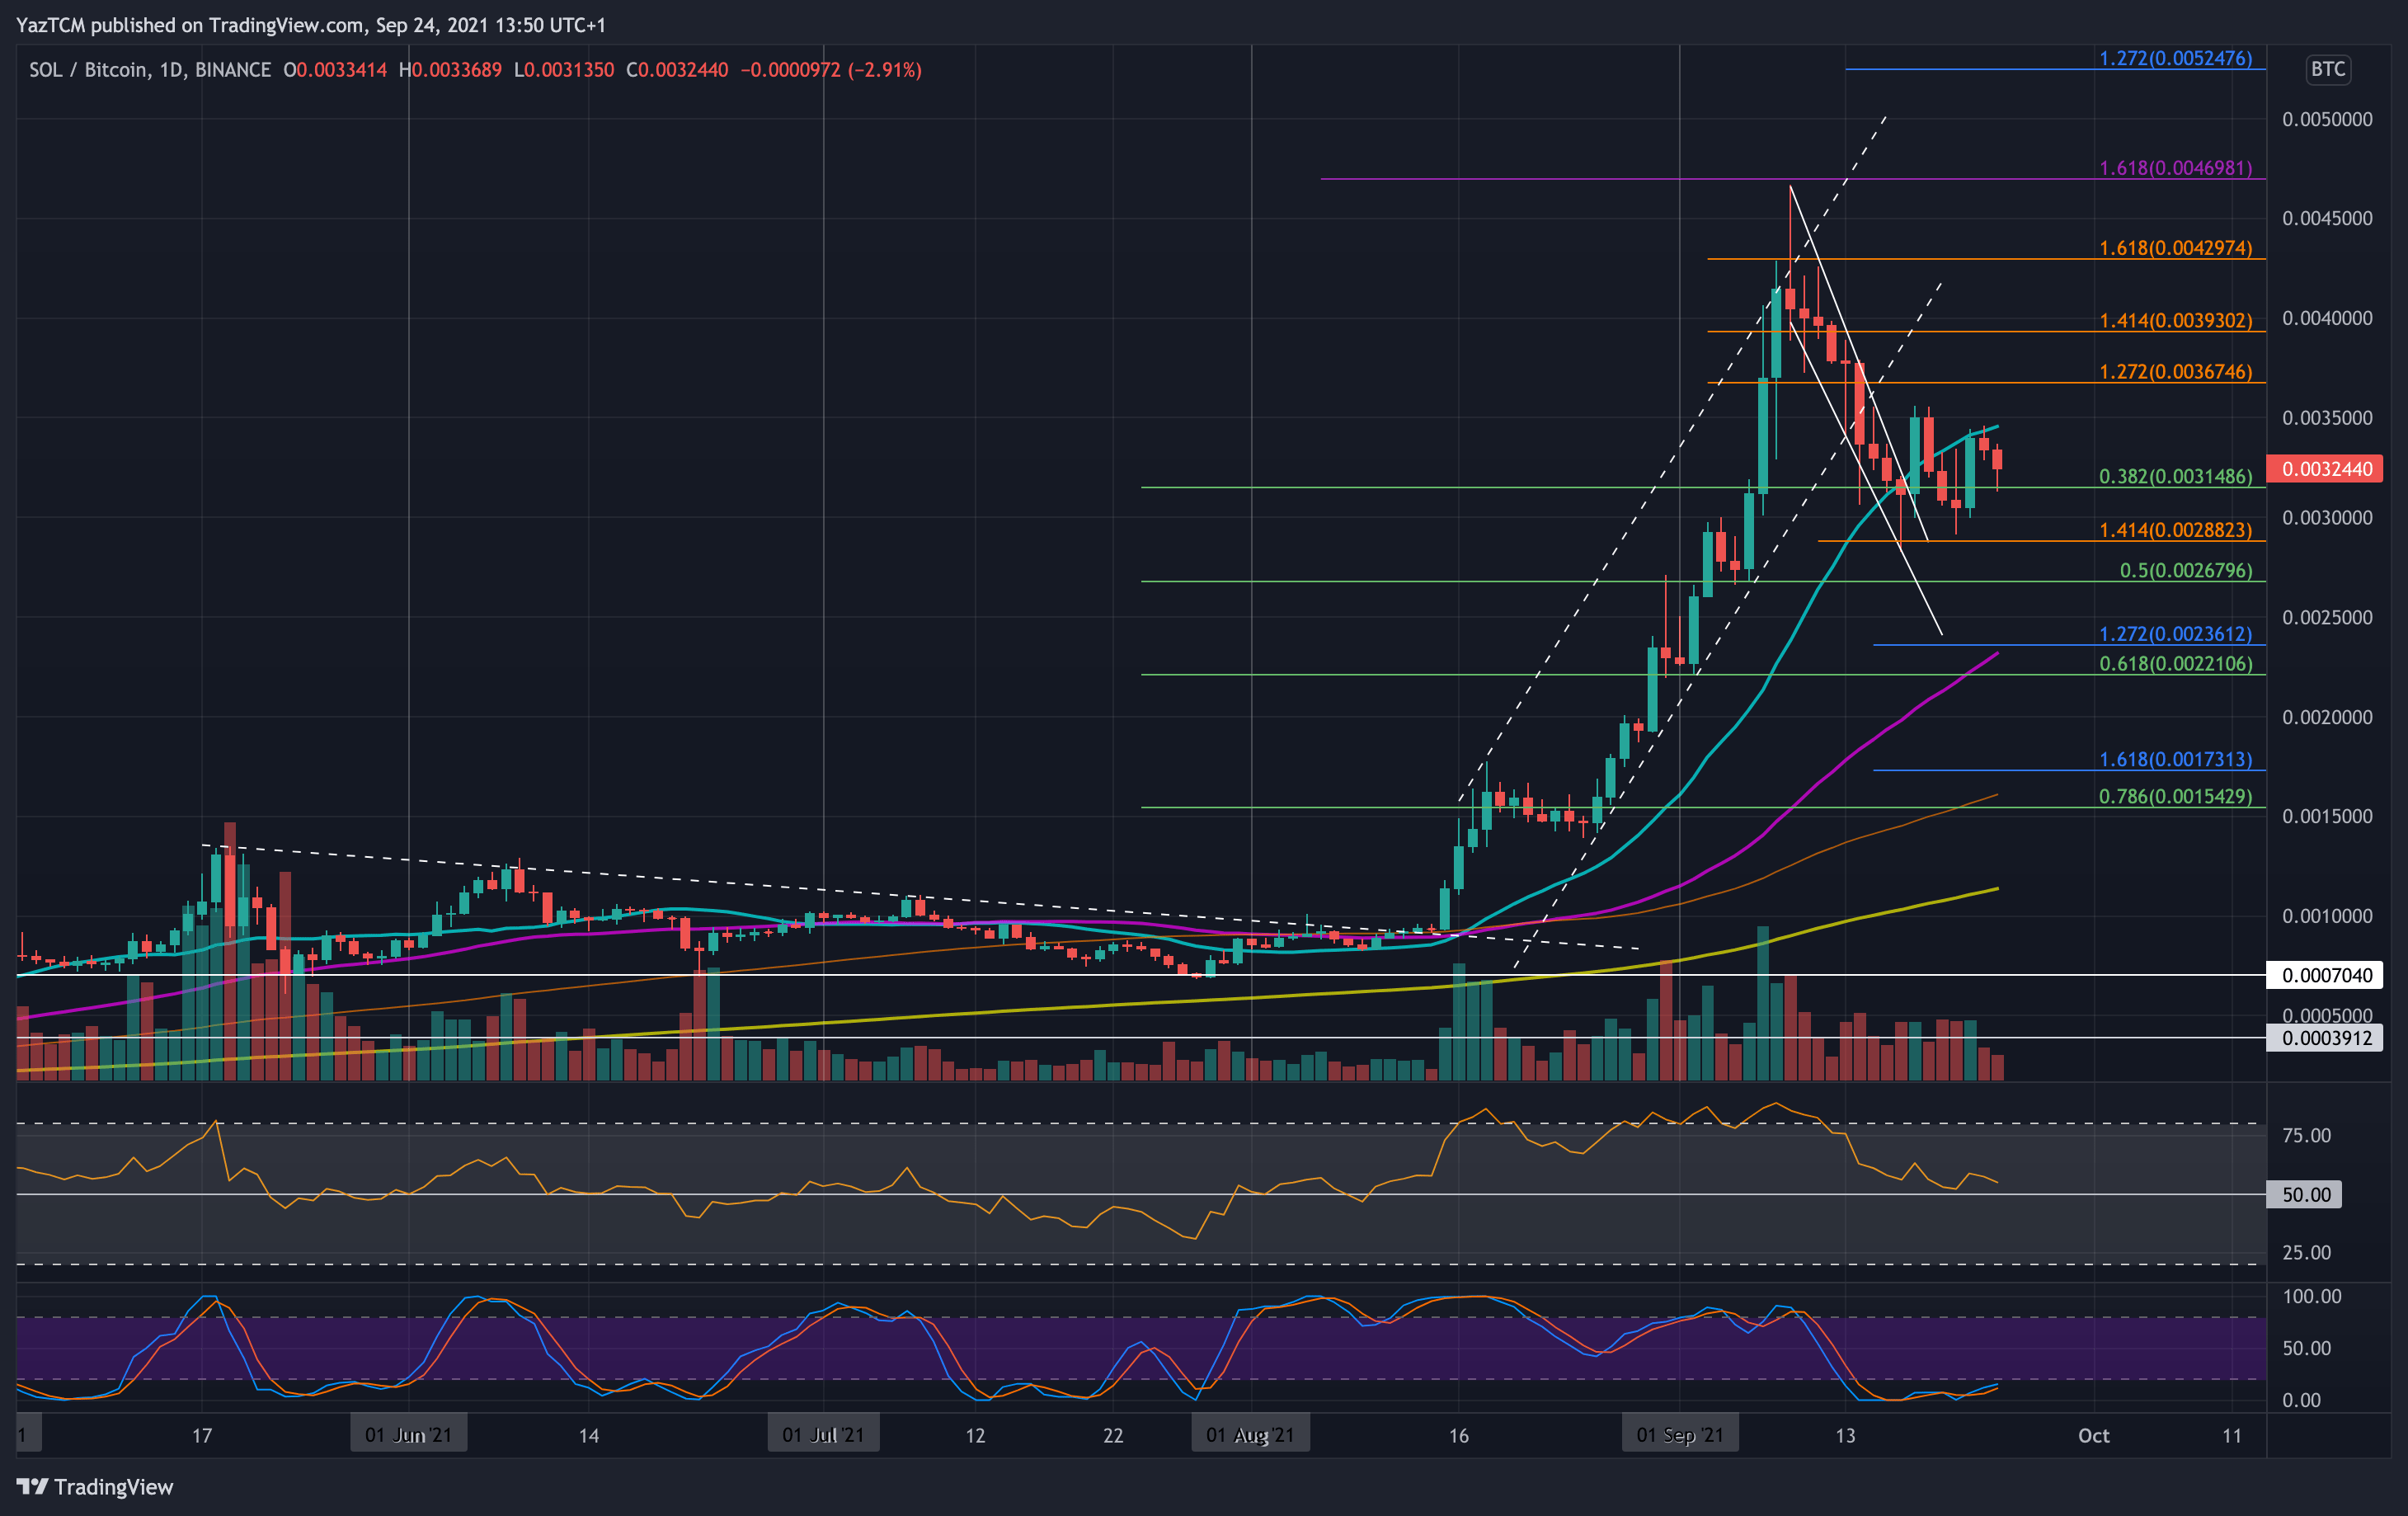
SOL is currently in a phase of consolidation against BTC as it trades sideways between 0.0035 BTC and 0.003 BTC. The coin found support at 0.003 BTC on Tuesday and bounced higher on Wednesday to meet the resistance at the 20-day MA, beneath 0.0035 BTC.
It ended up rolling over from there yesterday to find the support at 0.00315 BTC (.382 Fib) today.
Looking ahead, the first solid support lies at 0.003 BTC. This is followed by 0.00288 BTC (downside 1.414 Fib Extension), 0.00267 BTC (.5 Fib Retracement), 0.0025 BTC, and 0.00233 BTC (50-day MA).
On the other side, the first resistance lies at 0.0035 BTC (20-day MA). This is followed by 0.00367 BTC (1.272 Fib Extension), 0.004 BTC (1.414 Fib Extension), and 0.0043 BTC (1.618 Fib Extension).
Avalanche
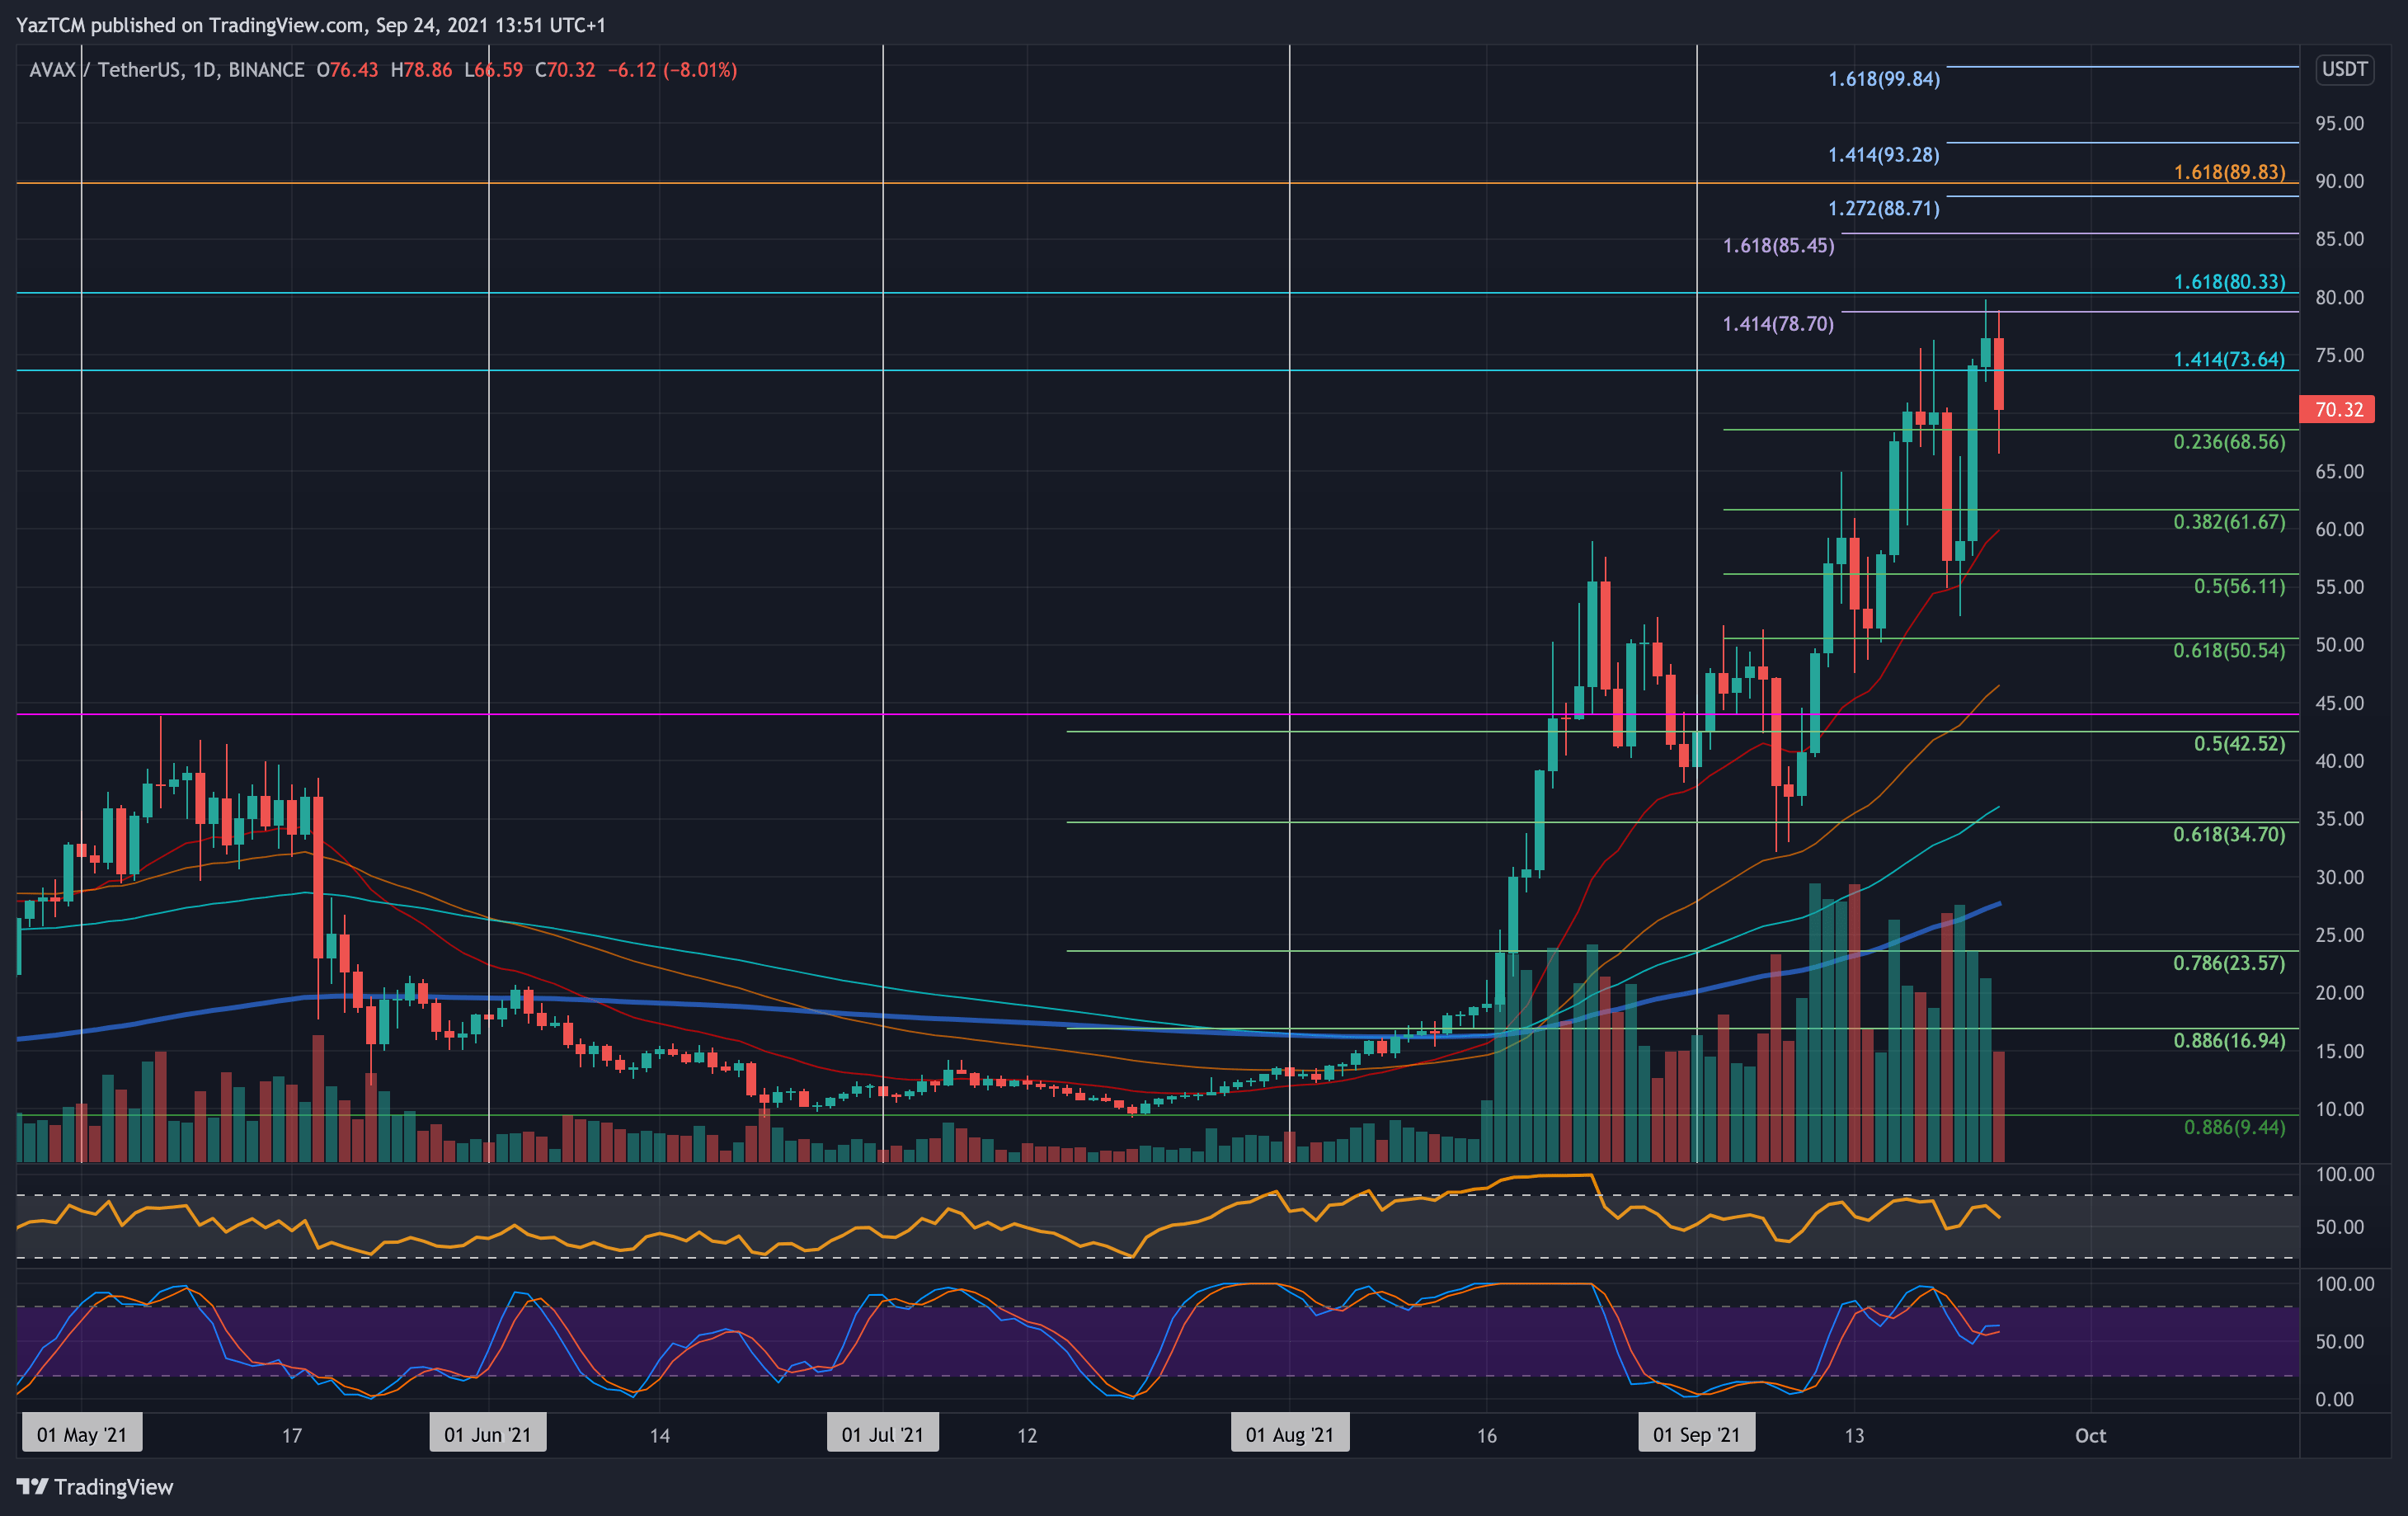
AVAX is up by a small 3% this week as the coin sits around $70. The cryptocurrency actually managed to set a new ATH price at $80 this week after finding support at the 20-day MA (around $55) on Monday.
It held the $55 support on Tuesday and exploded on Wednesday to hit $75. The new ATH was set on Thursday, but AVAX has since rolled over to fall to $70 today.
Looking ahead, the first support lies at $68.55 (.236 Fib). This is followed by $65, $61.67 (.372 Fib), $60 (20-day MA), and $56.10 (.5 Fib).
On the other side, the first resistance lies at $75. This is followed by $80, $85.45 (1.618 Fib Extension), $90 (1.618 Fib Extension – orange), $92.30 (1.414 Fib Extension – blue), and $100.
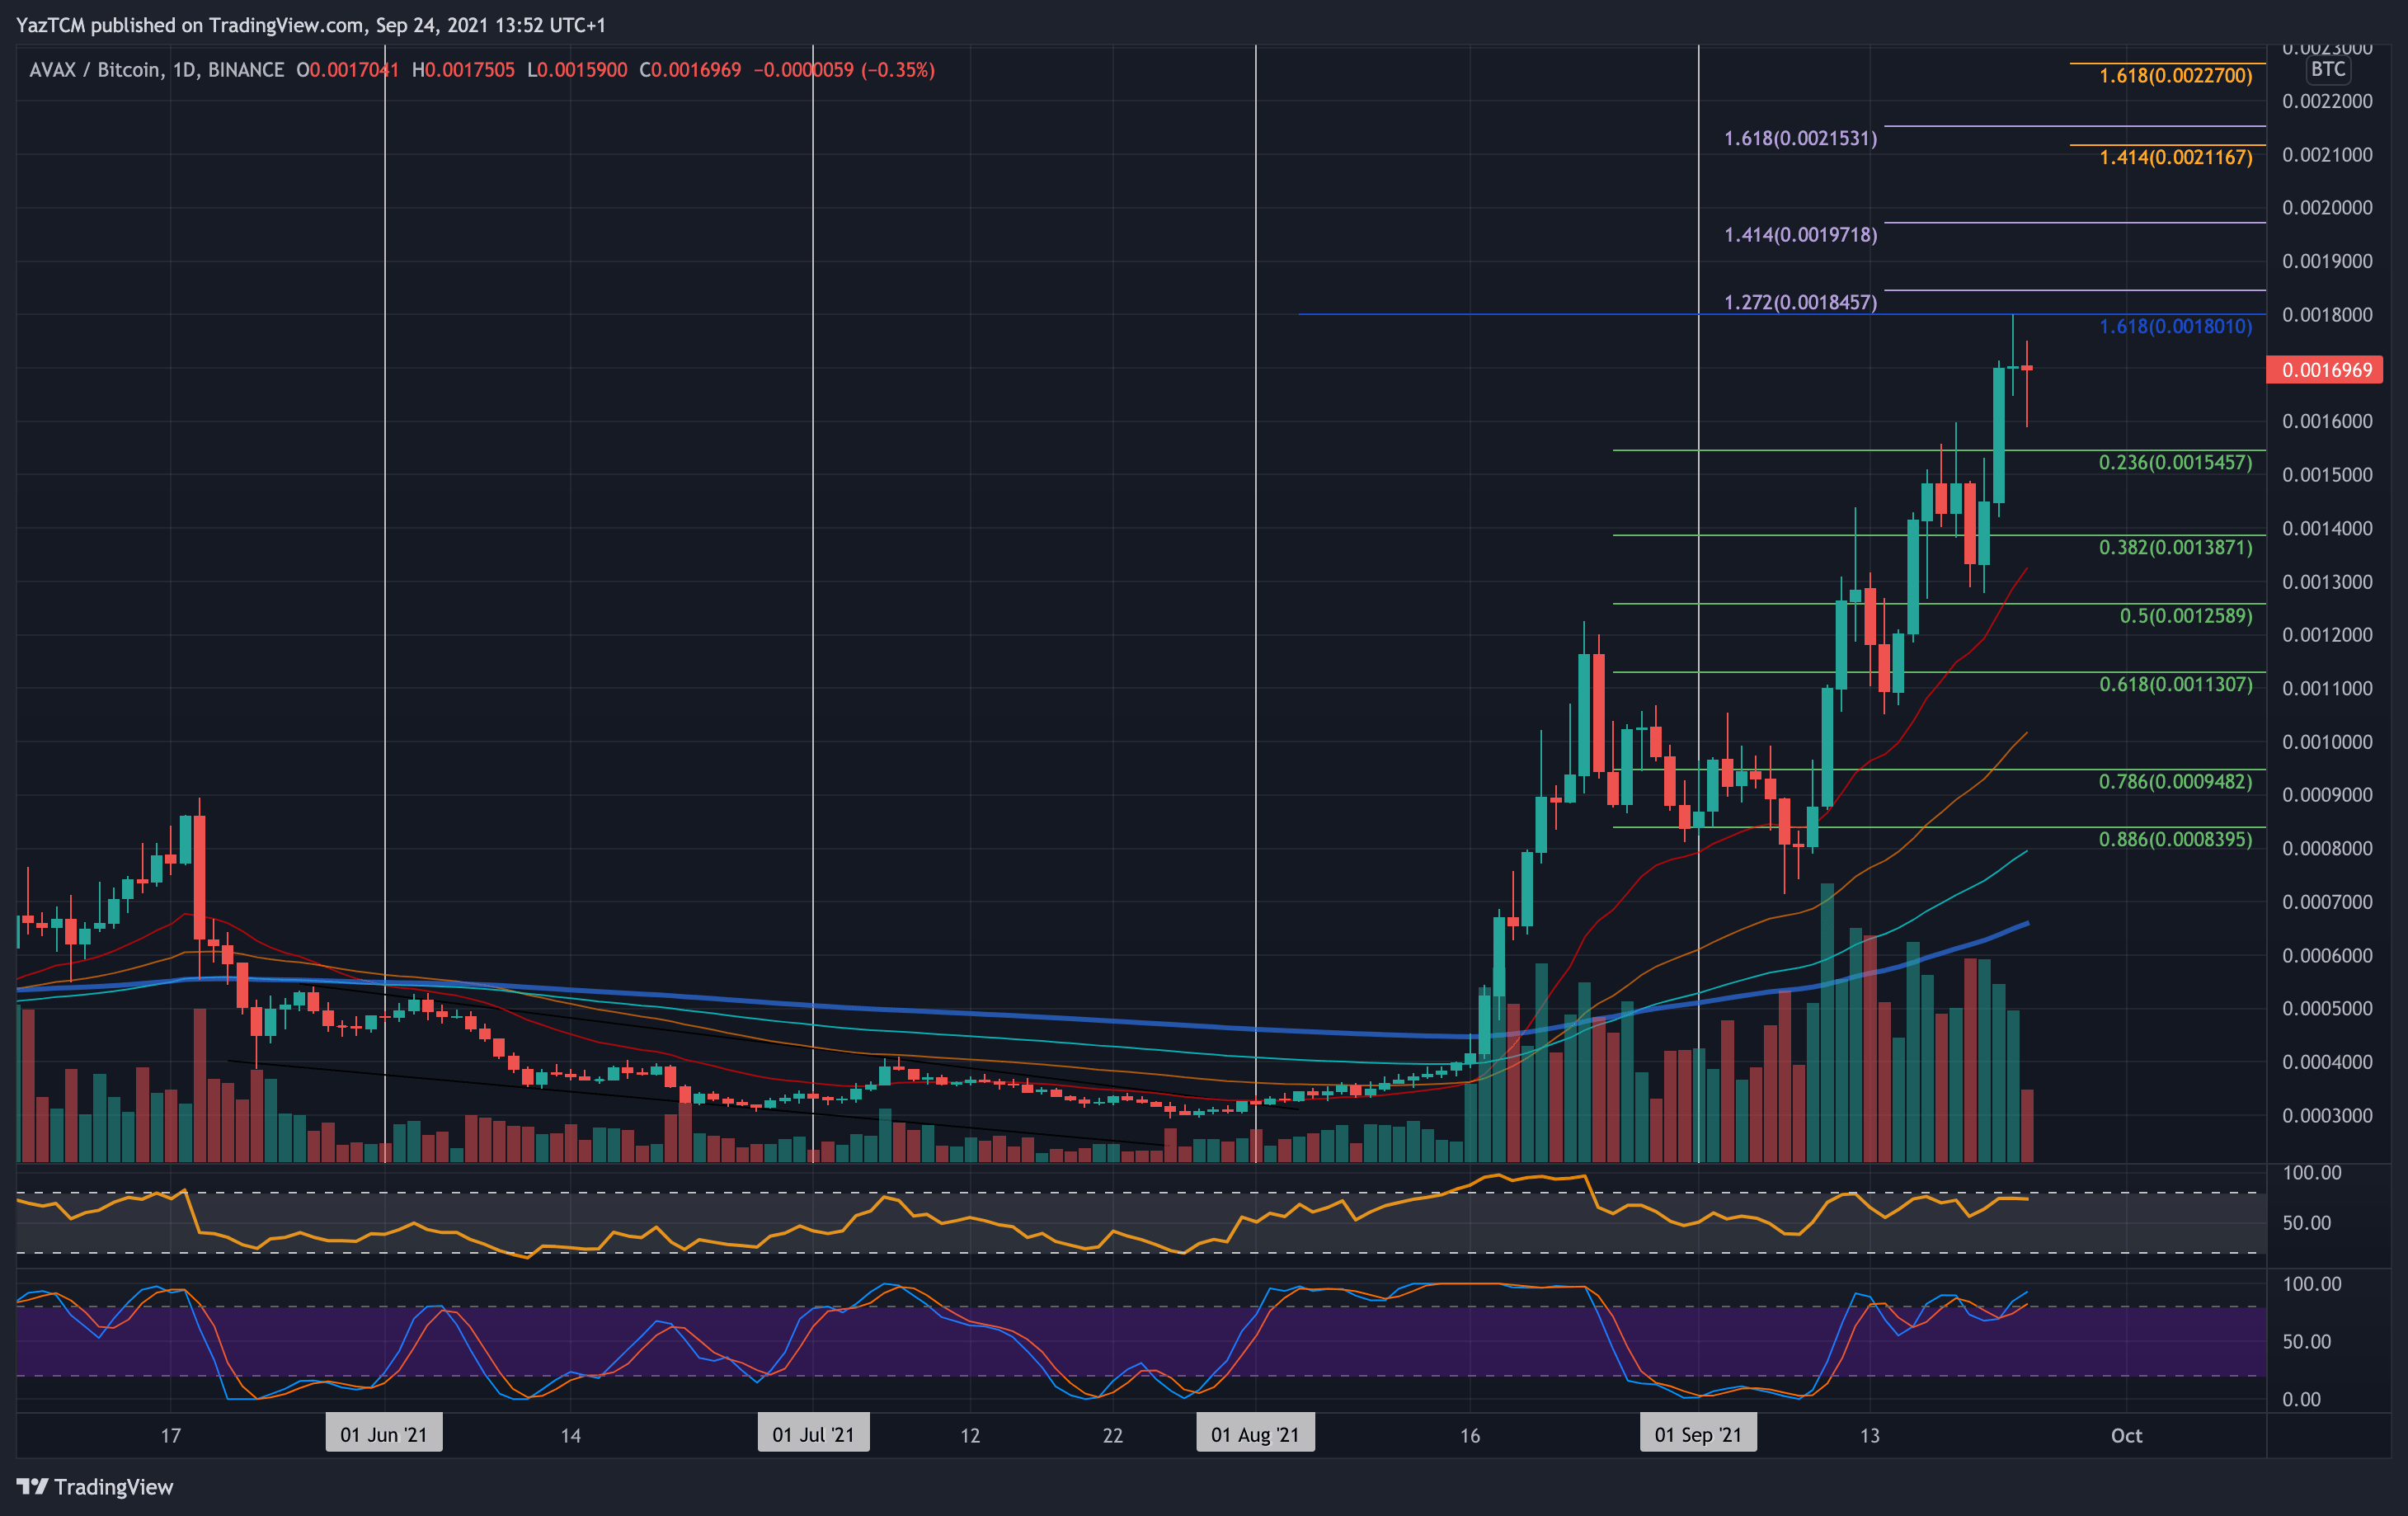
AVAX is also performing well against BTC after setting a new ATH on Thursday at 0.0018 BTC. The coin fell beneath support at 0.0014 BTC on Monday but managed to hold support at 0.0013 BTC on Tuesday.
It rebounded from there and ended up breaking the previous 0.0016 BTC ATH on Wednesday. Yesterday, it spiked higher to reach the new ATH at 0.0018 BTC but has since dropped back to 0.0017 BTC.
Looking ahead, the first resistance lies at 0.0018 BTC. This is followed by 0.00185 BTC (1.272 Fib Extension), 0.0019 BTC, 0.00197 BTC (1.414 Fib Exnteison), 0.002 BTC, and 0.0021 BTC.
On the other side, the first support lies at 0.0016 BTC. This is followed by 0.00155 BTC (.236 Fib), 0.00138 BTC (.382 Fib), 0.0013 BTC (20-day MA), and 0.00125 BTC (.5 Fib).