Wanchain and Serum prices are cooling off after rallying throughout August. WAN and SRM prices might drop towards $0.75 and $6 in the short to medium term.
Wanchain (WAN)
Wanchain, an Ethereum hard fork, is interoperable using WAN as the primary currency.
Past Performance of WAN
The Wanchain crypto is under pressure, representative of the general state of the market.
At the time of writing, WAN is down roughly nine percent versus the greenback, trailing lower as per the WAN technical analysis of the daily chart.
Day-Ahead and What to Expect
The uptrend is invalid as long as WAN crypto prices trend below the September 7 high volume trend-setting bar.
At present, WAN coin prices are printing lower, as visible from the daily chart.
Even so, Wanchain prices might change for the better if there is a close above $1 in the short term. This might reinvigorate price action, drawing demand for Wanchain prices.
Wanchain Technical Analysis
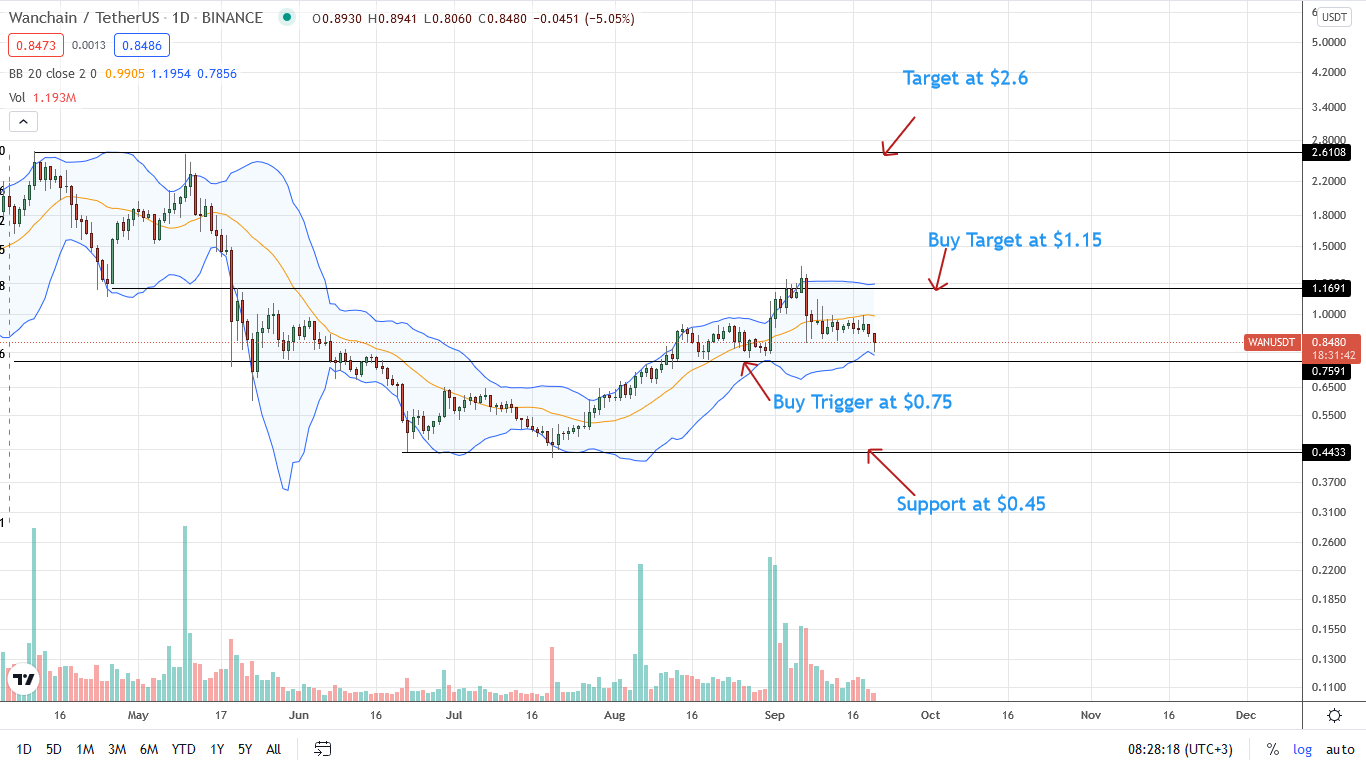
Wanchain is under pressure, and sellers are taking charge, as evident from the daily chart.
Aforementioned, a close above $1 might draw demand, lifting WAN crypto towards $1.15. On the reverse side, it would be enough for sellers to force WAN back to $0.75 and $0.45 in a bear trend continuation set in motion by the September 7 bear candlestick.
Serum (SRM)
Serum, the DEX on Solana, depends on the SRM governance token.
Past Performance of SRM
There is a shift in trend observable in the SRM coin price action.
Presently, SRM is trending middle BB—a dynamic support line—in a bear breakout pattern below $12.5.
Day-Ahead and What to Expect
The SRM token is weaker, as per the SRM technical analysis. Currently, prices are trading in a bear breakout pattern. It is in a retracement that may see the SRM coin plunge below $9, marking what may be the beginning of even deeper corrections.
On the flip side, the only narrative that might change this are higher highs above $12.5. This may ignite demand, lifting SRM crypto to new 2021 territories—which is now unlikely in the immediate term.
SRM Technical Analysis
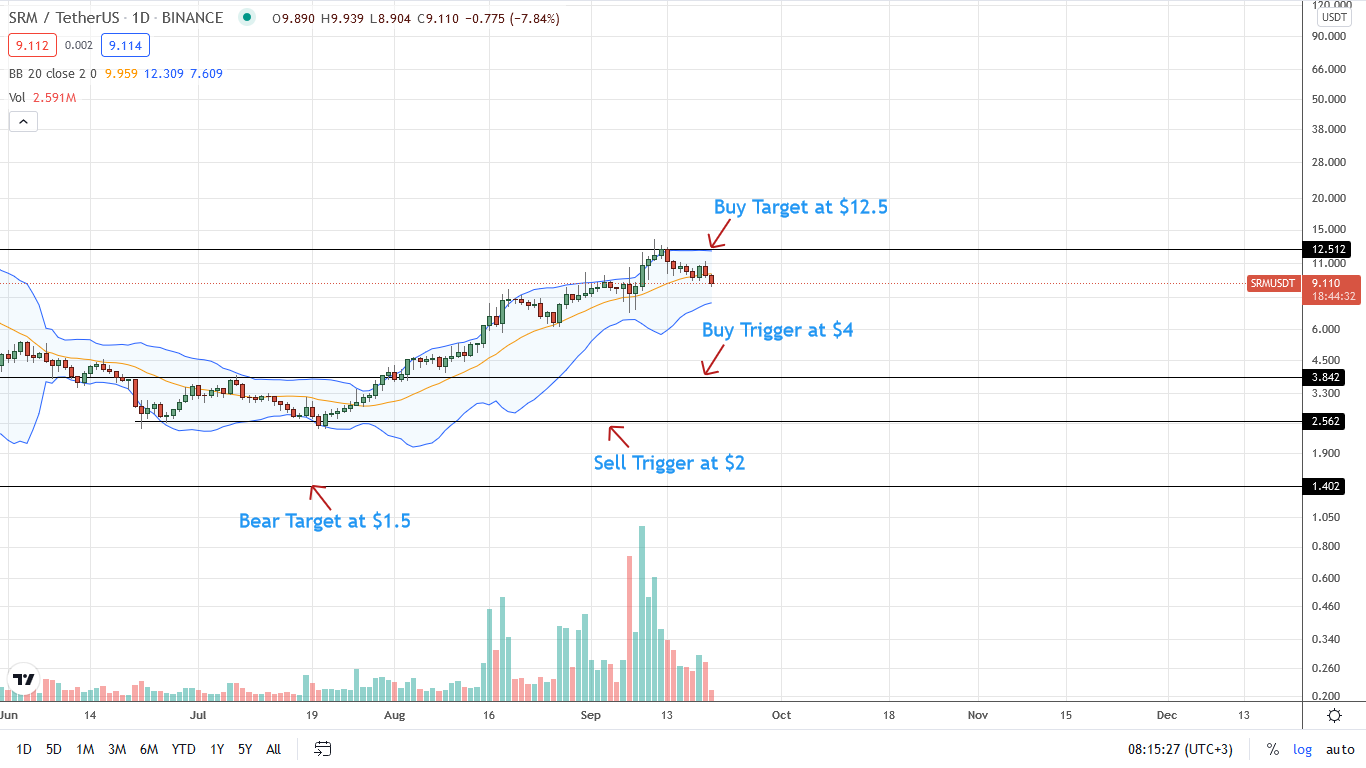
There are lower highs relative to the upper BB, signaling the weakness of SRM token prices.
Aforementioned, $12.5 is a strong resistance level. If SRM bulls overcome this mark, the coin might expand to new H2 2021 highs.
However, a loss below $9 is enough to print lower lows back to $6—the 61.8 percent Fibonacci retracement level of the July to September 2021 trade range.