HNT price is under tremendous bearish pressure. HNT may drop below the $15 mark.
Helium is an open-source sharding multichain protocol that allows cross-chain transfers of all data and asset types. This interoperability is intended to create a decentralized and private web controlled by its users. It also makes it simple to create new services, institutions, or applications.
Past Performance of HNT
HNT coin price action forms a descending triangle pattern in the past few weeks. The token price is in close proximity to the support zone near $18. Investors can enter with short positions if the pattern gives a bearish breakout.
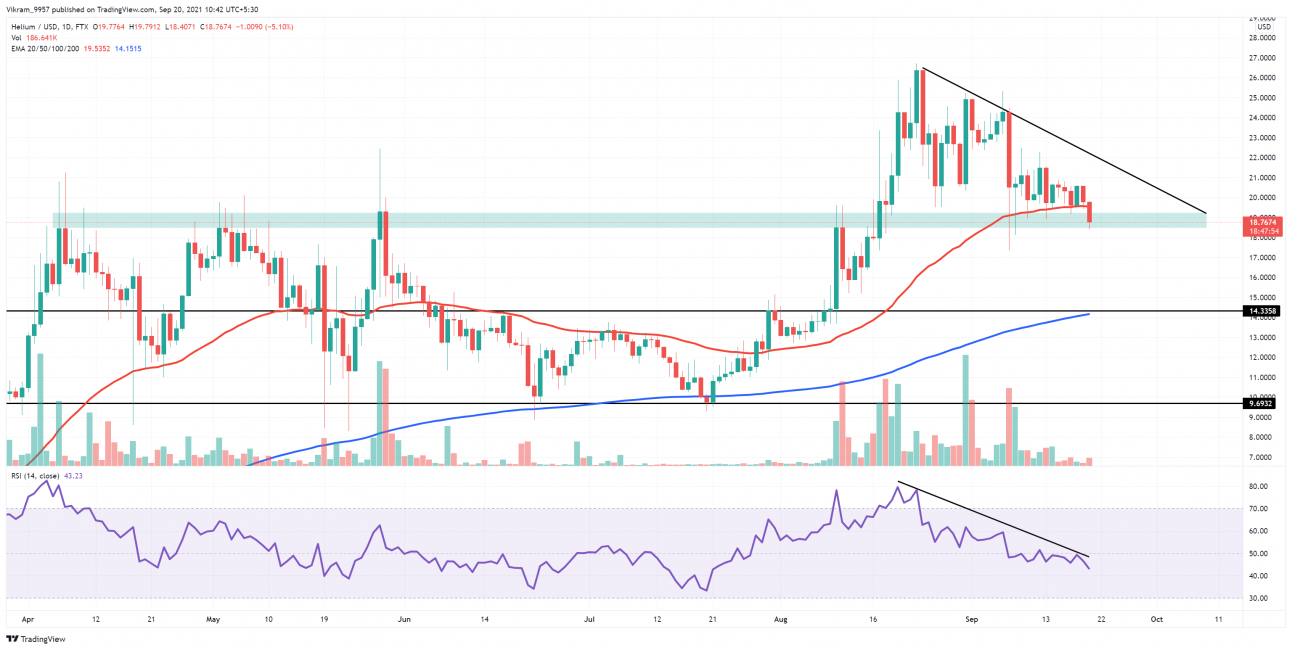
Source - Tradingview
HNT Technical Analysis
Helium coin price is trending lower after facing rejection near the $26 mark. Thus, resulting in downfall to the $18 support zone. The price action has been forming lower highs resulting in the descending triangle pattern.
The chances of a bearish breakdown of the price pattern are increased as the price trades closely within the support zone.
As of writing the article, HNT token price is trading at $18.61. The price is 7.58% down in the last 24 hours, resulting in the bearish candlesticks that may soon give a breakdown.
The price action of the HNT token suggests that the price may find support near the $14 support level. In the unlikely event of a bullish reversal, the price might struggle near the $24 resistance zone.
The Helium Crypto is already trading below the 50-day Exponential Moving Average. The breakout of the mentioned price pattern may drive the price lower to the 200-day EMA.
Currently, the RSI indicator is at 42%. The slope of the RSI has been trending lower since the price pattern formation. Thus, underlying bearish pressures are gradually increasing, evident from the bearish divergence pattern. Investors must be patient and need to wait and watch if the price closes below the candlestick pattern. Till then, investors must be careful of a bullish reversal.
Day-Ahead and Tomorrow
As per the Helium technical analysis, the cryptocurrency represents a bearish breakout of a crucial support zone. The breakout will increase the underlying bearishness up a notch.
The Helium crypto is trading above the 50% Fibonacci pivot level of $18. However, the increasing bearishness may soon crash below this level.