- AVAX rejected 50 day ema and heading towards a yearly low at $11.15
- The MACD is reversing upside and may generate positive crossover in the coming few weeks.
- Meanwhile, the RSI at 39 recovered from the oversold zone which may be an indication of a relief rally soon.
Avalanche (AVAX) Price had been trading with mild bullish cues and showing signs of short term base formation but it will be difficult for buyers to push the price above $14.00 resistance levels. Currently, AVAX/USDT is trading at $11.73 with the intraday gains of 0.43% and 24 hour volume to market ratio stood at 0.03
Will the AVAX be able to reclaim 50 day ema ?
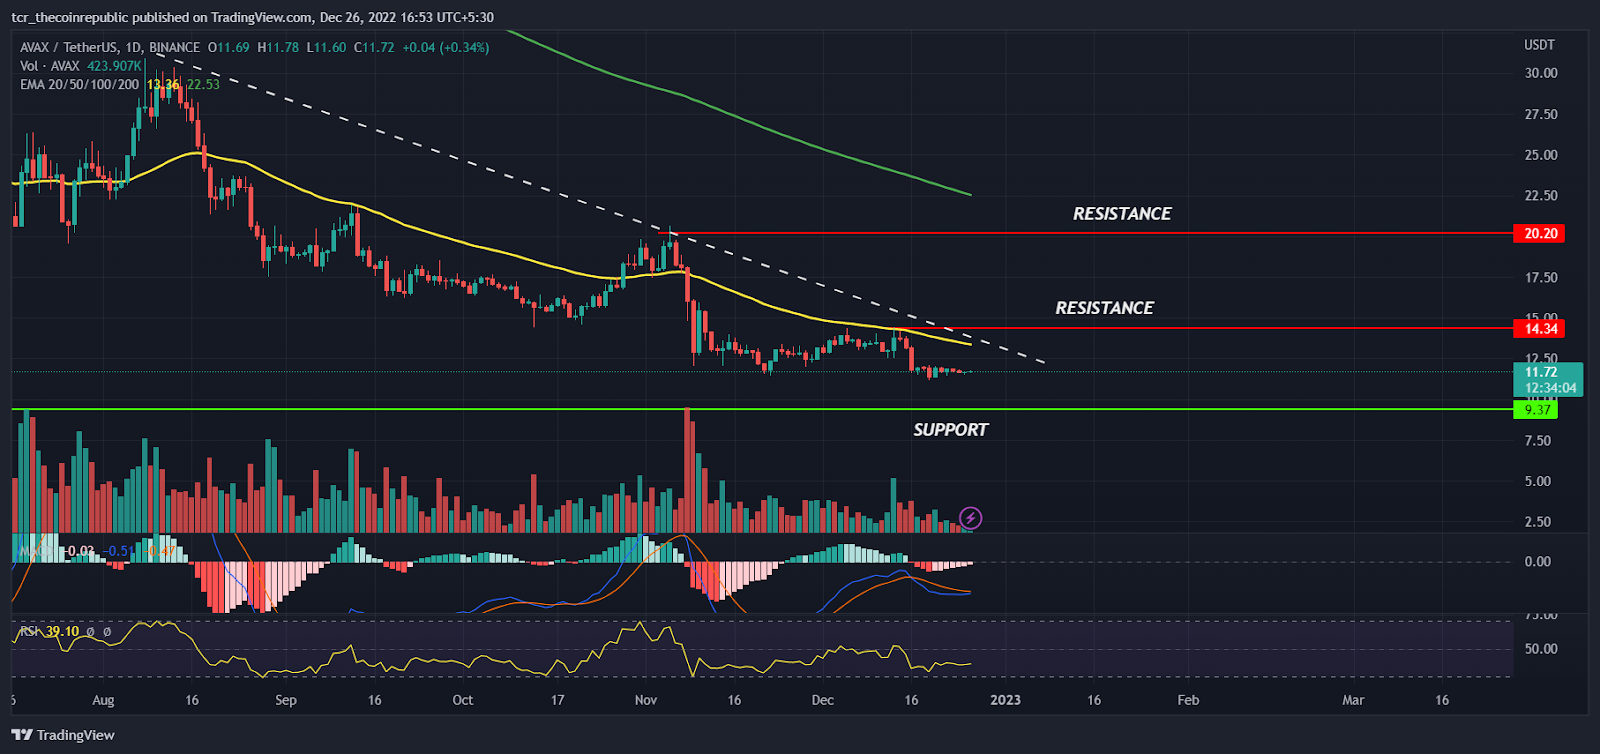
On a daily time frame, AVAX prices are in downtrend and are continuously slipping down forming lower lows swings. In the month of August bulls were able to sustain above 50 day ema for a short span of time which triggered a positive upside moment and created a swing high at $30 but sellers were aggressive on higher levels and kept on pulling the down. In the end of October, bulls again attempted to reverse the trend but unfortunately it also resulted as a bulls trap and ended up creating fresh yearly lows.
The 200 day ema(green) sloping down indicates a trend to remain down on a positional basis and the 50 day ema (yellow) at $13.36 will act as an immediate hurdle in coming days followed by the next barrier at $14.34 and $20.20. On the lower side, AVAX prices may find little stability at $9.37levels. The MACD is reversing upside and may generate positive crossover in the coming few weeks. Meanwhile, the RSI at 39 recovered from the oversold zone which may be an indication of a relief rally soon.
Short term trend reversal possible ?
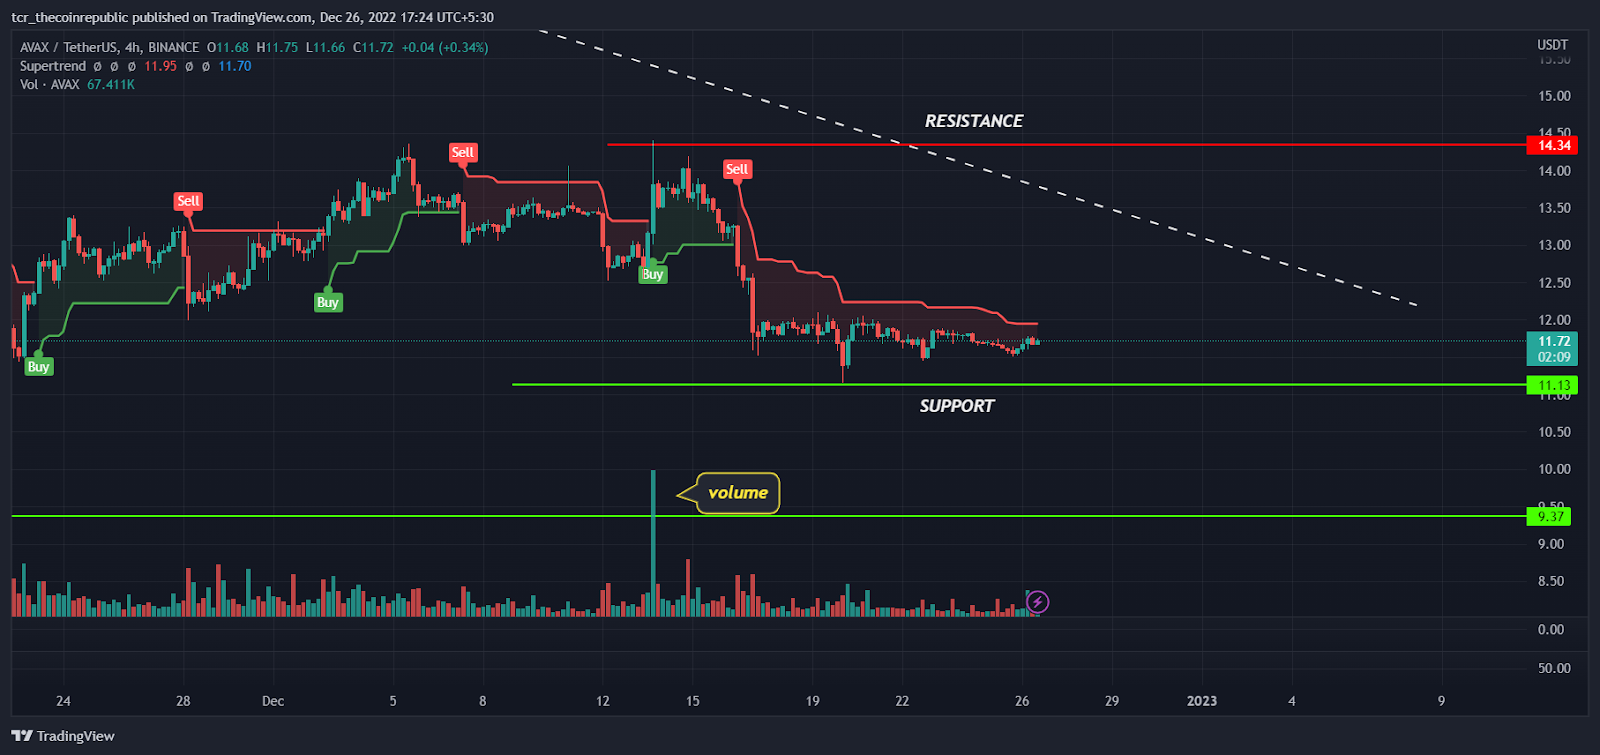
On a lower time frame, AVAX prices are trading sideways in the range between $11.00 to $14.34 with a bearish bias and likely to expand in either direction soon. Recently, in the mid of December, bulls attempted to breakout of a higher range of $14.00 with a more than normal volume but it ended up as a bulls trap and prices slide back to its lower range support. The super trend had also generated sell signal and resistance line kept on slipping down indicating the short term trend is still in bear grip but if bulls succeed to trade above $12, buyers may see minor pullback rally in coming days.
Summary
AVAX had been an under performer for a quite longer time and still does not show any strong signs of recovery in coming weeks. As per price analysis, AVAX may try to show some sort of relief rally in coming days but may not be able to attract genuine buyers. So, it’s better to avoid creating buy positions at lower levels till prices trading below $14.34 levels.
Technical levels
Resistance levels : $14.34 and $20.20
Support levels : $40.00 and $9.37
Disclaimer
The views and opinions stated by the author, or any people named in this article, are for informational ideas only, and they do not establish financial, investment, or other advice. Investing in or trading crypto assets comes with a risk of financial loss.