The Bitcoin (BTC) price broke down from an ascending parallel channel. The Ethereum (ETH) price created a double bottom pattern. The XRP (XRP) price is still trading inside a symmetrical triangle.
Bitcoin Price Creates Bullish Engulfing Candlestick
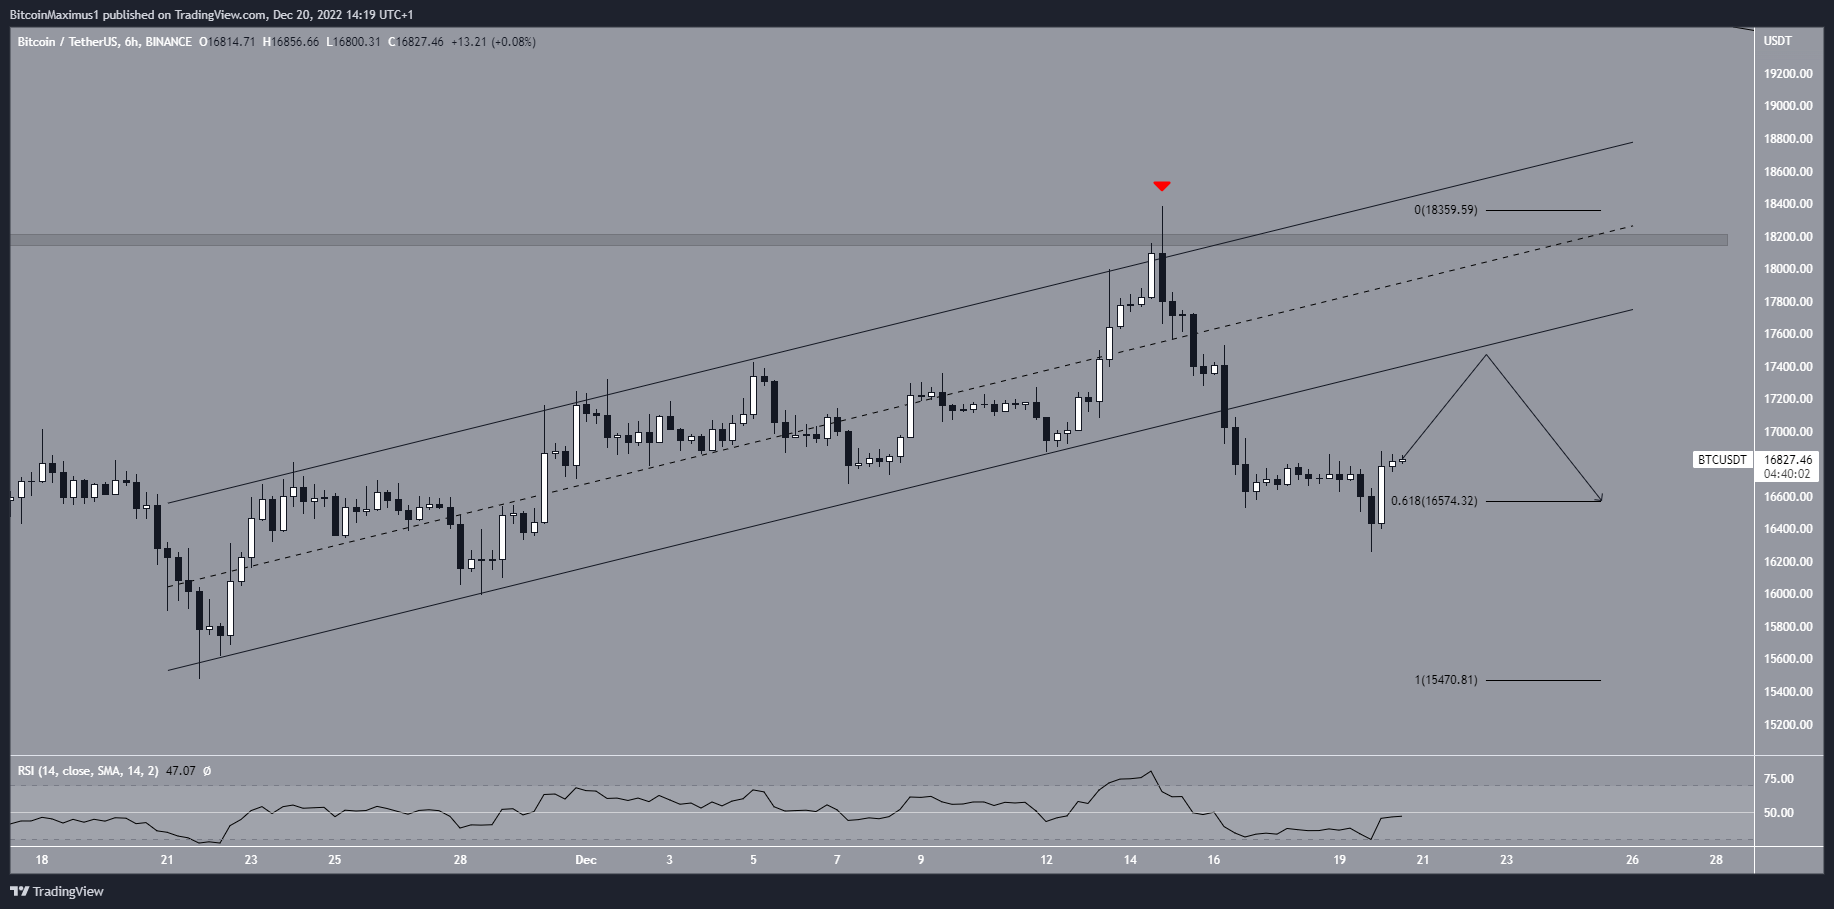
The Bitcoin price has increased inside an ascending parallel channel since Nov. 21. The upward movement led to a high of $18,387 on Dec. 14. At the time, it reached the resistance line of the channel and the $18,200 resistance area. Afterward, the ensuing drop created a long upper wick (red icon) and caused a breakdown from the channel two days later.
On Dec. 19, the Bitcoin price fell to a low of $16,256 and bounced, validating the 0.618 Fib retracement support level at $16,575. The same day, it created a bullish engulfing candlestick. This also caused the RSI to move outside of its oversold territory. The Bitcoin price has increased over the past 24 hours.
As a result, the most likely BTC price forecast is an upward movement toward the channel’s support line. Afterward, a drop would be expected.
Closing below the 0.618 Fib retracement support level at $16,850 would invalidate this bullish projection.
ETH Price Creates Bullish Pattern
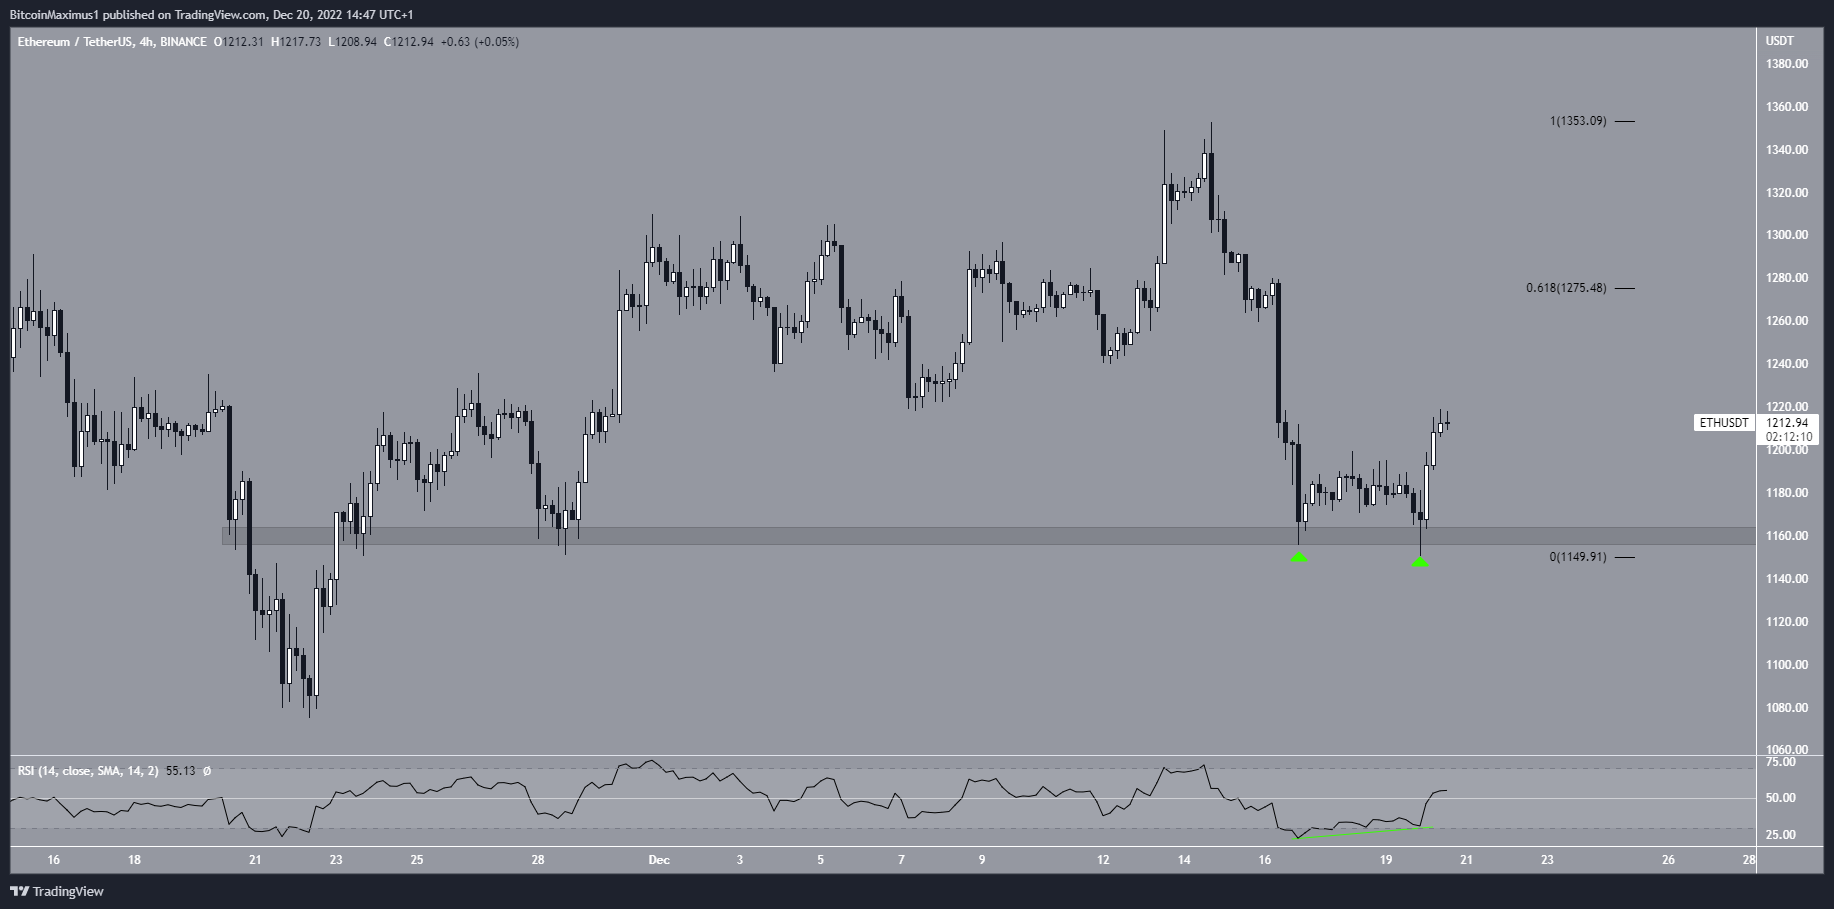
ETH is the native token of the Ethereum blockchain, created by Satoshi Nakamoto. The Ethereum price created a double bottom pattern inside the $1,160 horizontal support area in Dec.16 – 20 (green icons). The double bottom is considered a bullish pattern, meaning that it leads to upward movements most of the time. Furthermore, the pattern was combined with bullish divergence in the RSI, increasing its legitimacy (green line).
If the upward movement continues, the closest resistance area would be at $1,275, created by the 0.618 Fib retracement resistance level. On the other hand, closing below the $1,160 support area would mean that the trend is bearish instead.
Additionally, it is interesting to note that since the release of Ethereum 2.0, the Ethereum network has seen a decrease in its circulating supply and annual emissions.
XRP Price Bounces at Support Line
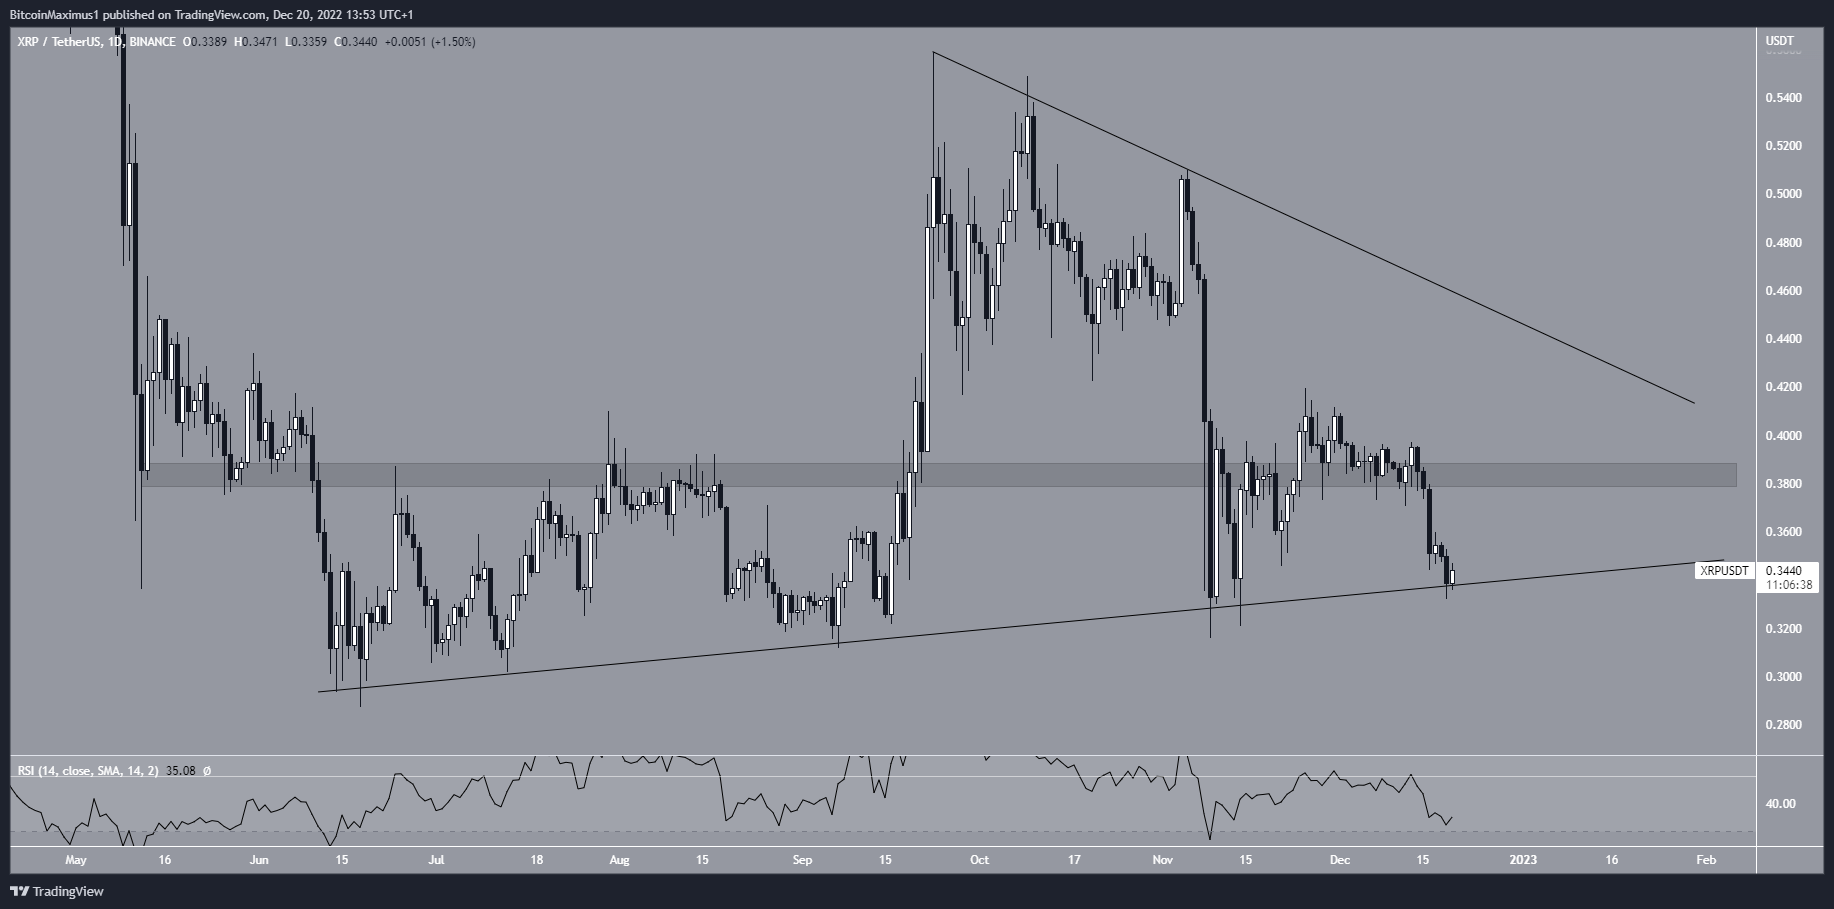
XRP is the native token of Ripple Labs, created by Jed McCaleb. It is mostly used as a global payments network. The XRP price has increased alongside an ascending support line since the beginning of June. The line has been validated numerous times, most recently on Dec. 19 (green icon). However, a bounce has yet to occur after this validation.
If one occurs, the closest resistance area would be at $0.385. Conversely, a breakdown from the ascending support line would likely lead to a downward movement toward the yearly lows at $0.30.
Since the daily RSI is below 50, a breakdown is slightly more likely, though there are no strong signs in either direction.
To conclude, the BTC, ETH and XRP prices have all initiated bounces at varying degrees of strength. However, the direction of the long-term trend is still undecided for all of them.
For BeInCrypto’s latest crypto market analysis, click here.