In addition to dividends, KCS can also be used to pay for trading fees on the KuCoin Exchange, allowing users to enjoy discounts of up to 80%. It can be used to participate in the token sale on KuCoin Spotlight, as well as LockDrop/BurningDrop on Pool-X. There are other uses for the tokens as well, such as on the platform. Let us look at the technical analysis of KCS.
Past Performance
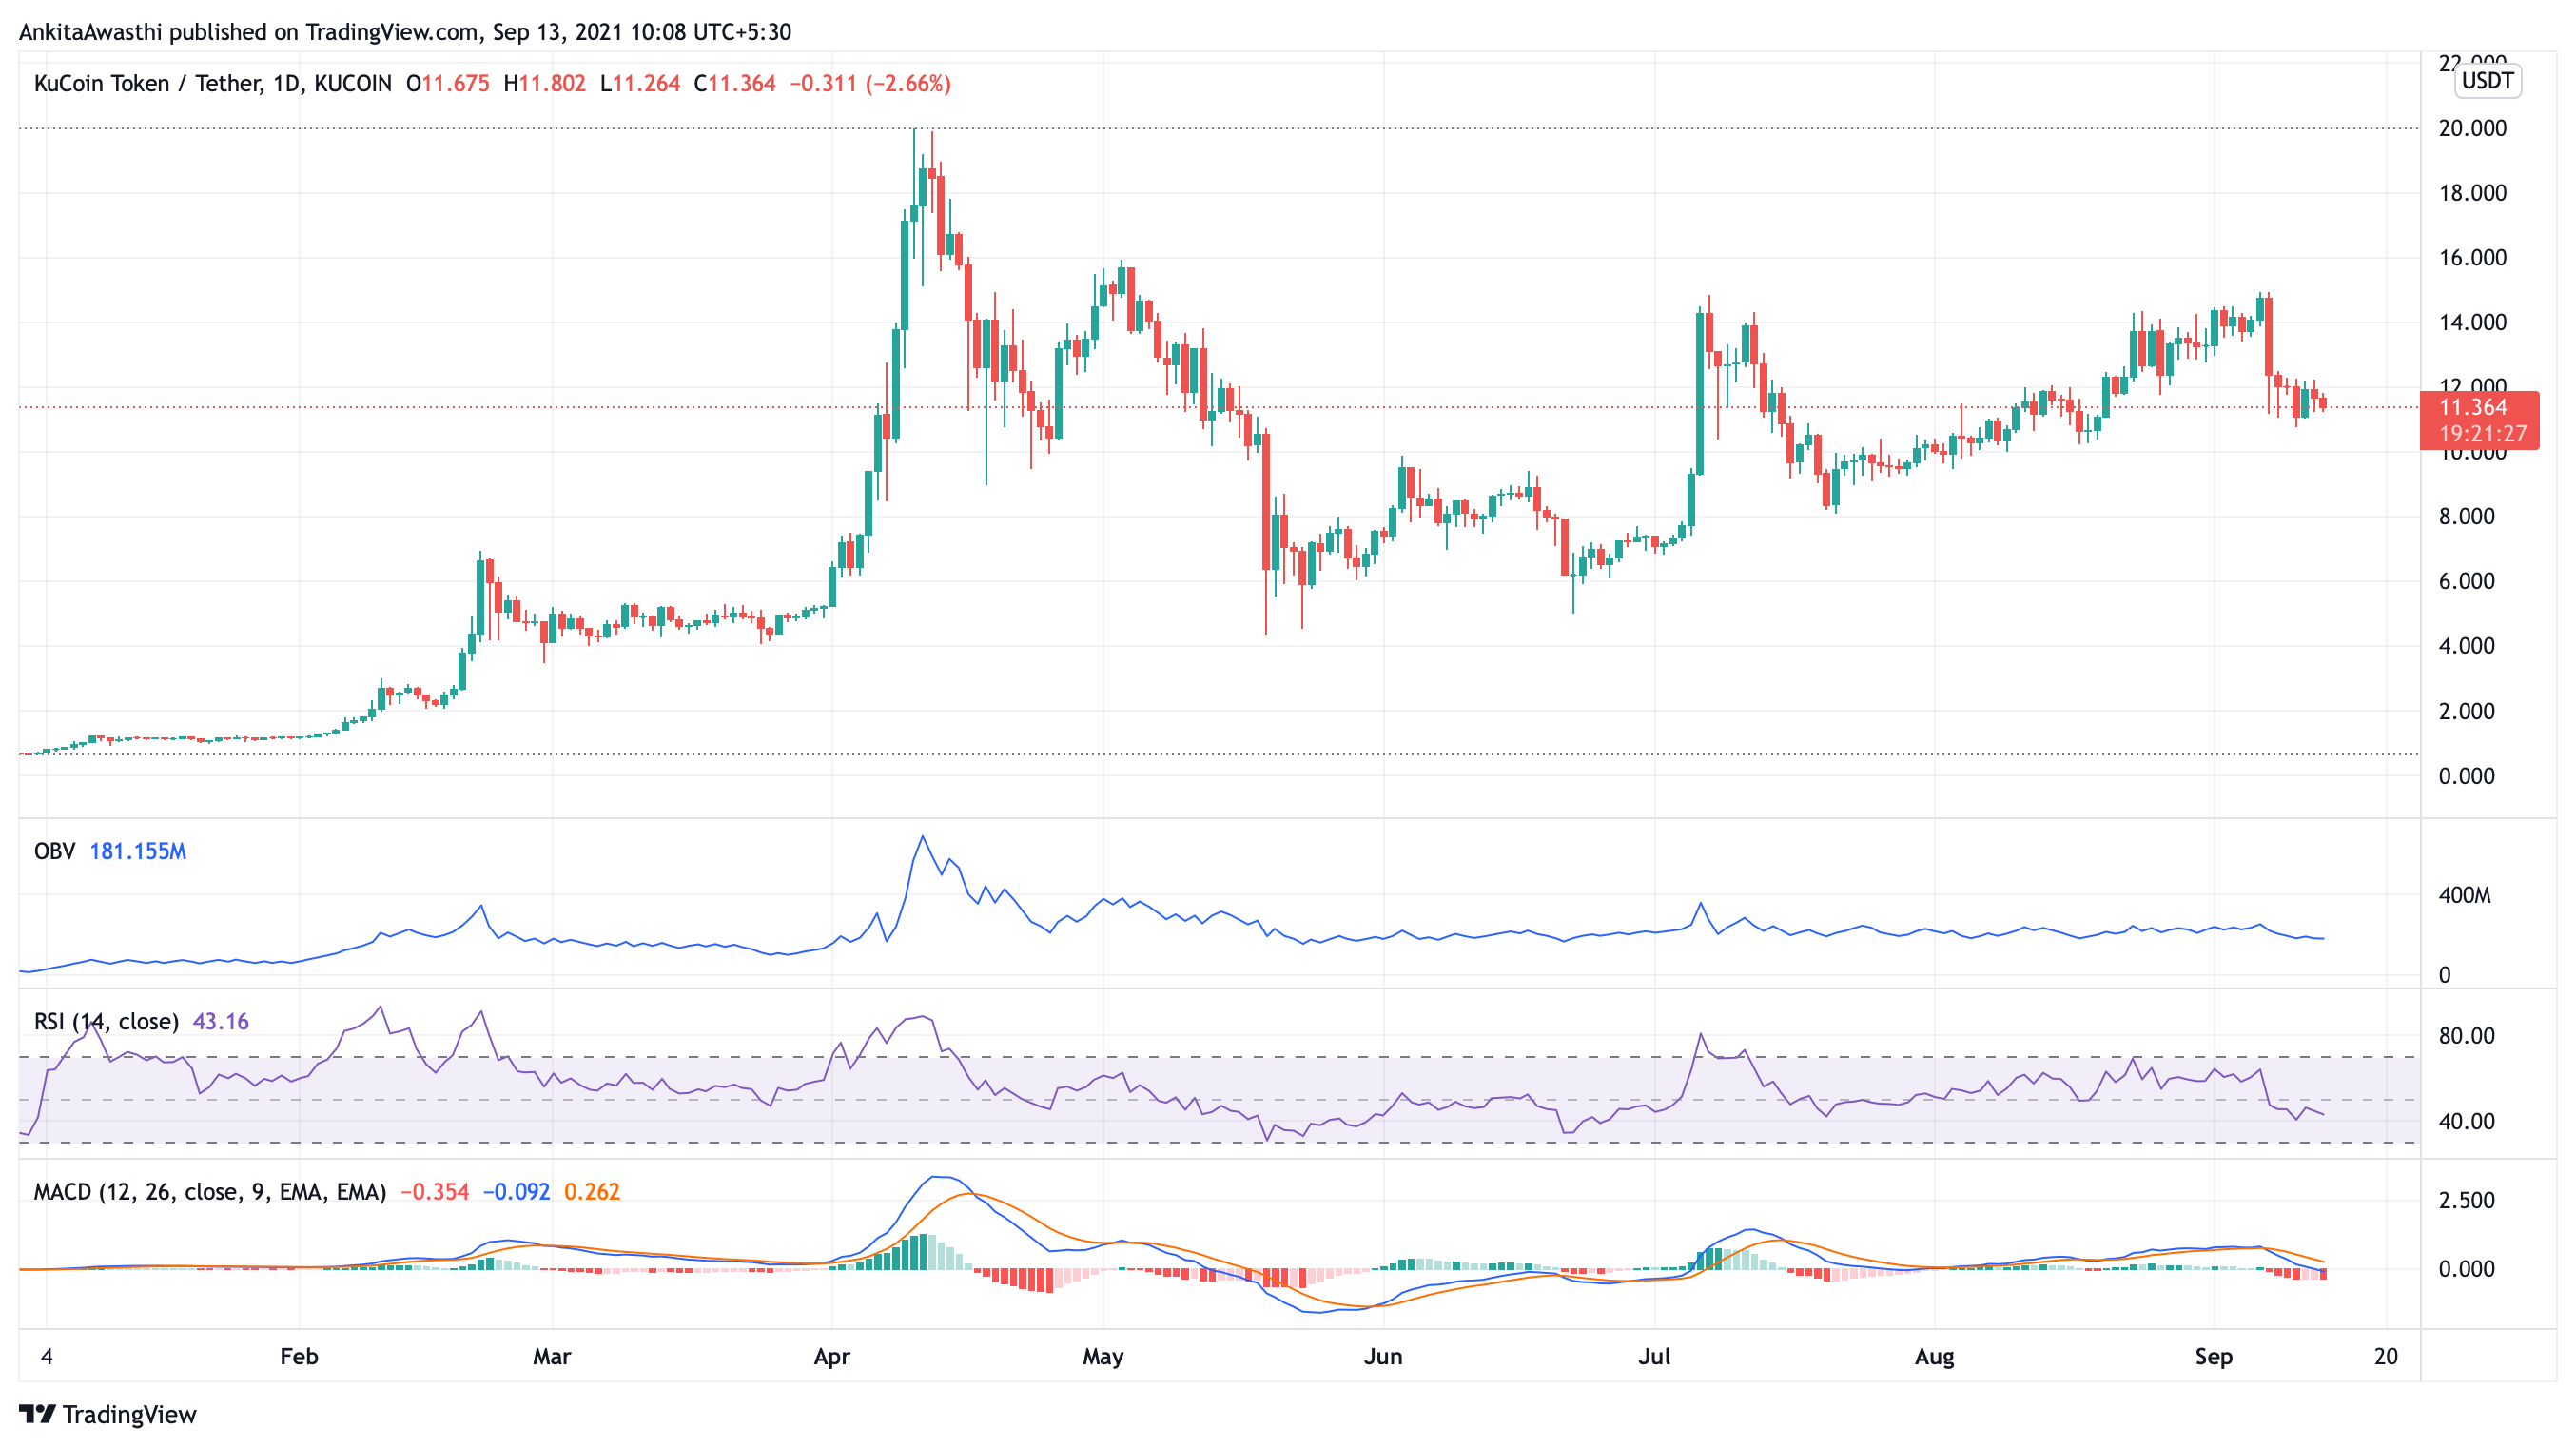
In the last seven days, the price depreciated 15.12%. In the last 24 hours, KCS is in a falling trend as the price further dipped by 4.78%. The current price of KCS is $11.34.
https://www.tradingview.com/x/pPcIJg2R/
KCS Technical Analysis
On the daily chart, the OBV is following a negative trend, suggesting the volume is dangerously low for KCS.
The RSI is at a 46.28% mark. It peaked at 57.20% and took a sharp downswing on the chart. The RSI is forming a bearish divergence, thus we can expect the prices to go down.
There is a bearish crossover on the chart, even though the MACD and EMA lines are above the zero range. Moreover, the lines are making a downtrend on the chart, suggesting they might fall below the zero range. Thus, the market is quite bearish for KCS.
Day-Ahead and Tomorrow
The KCS price is near its crucial resistance level at $11.6. If the price breaks out the level, the price will start rising, however, if the selling pressure persists the price will break further down.
If the price breaks out of the current level, it will highlight the $12.40 level because it has been a resistance level for a very long time. A breakout of this level will let KCS form new highs. Traders can take a short position accordingly.
However, as per the oscillators, the price will fall for the rest of the day. We have to closely watch the support levels of $10.80 and $10.25. If the price breaks down from these levels, traders can take a short position.