- ETH/BTC rises 10% in three days and puts the market in bullish mode.
- BTC/USD can reach $8,000 without compromising the medium term bullish trend.
- XRP is in a dirty area and lacks visibility.
Bitcoin is falling for the fourth consecutive day against the vast majority of assets – both inside and outside the crypto universe.
It is the first serious consolidation in more than seven months and a 300% surge. BTC/USD can fall to $8,000 without changing the bullish scenario.
Today’s market presents a great contradiction at a technical level, with falls in the short term that coincide with a strong bullish signal.
We are in an early stage of what can be the bull market with the most impressive multiples in history. Today, with the crypto market in red in front of all fiat currencies, the conditions that I have set out to be able to declare that the crypto market is in bullish mode have finally been fulfilled.
Readers who follow me will know that I am referring to the relationship between Ethereum and Bitcoin. As I explain in the analysis of this pair in the next section, the MACD has crossed up, a change confirmed by the 10% rise against Bitcoin of a basket of the leading Altcoins in the market.
This situation fulfills the second condition to be able to declare the Crypto market in bullish mode, with the first condition the break of the long term bearish channel in the BTC/USD pair.
ETH/BTC Daily Chart
The ETH/BTC pair trades at 0.028, rising for the fourth consecutive day and forms a double bottom in the 0.025 area 10% lower. It finds itself right in the face of price congestion resistance that separates the bearish terminal zone from a bullish transition zone full of technical obstacles.
Above the current price, the first resistance level is at 0.0282 (price congestion resistance), then the second resistance level is at 0.0293 (price congestion resistance and EMA50) and the third one at 0.03001 (price congestion resistance and SMA100).
Below the current price, the first support level is at 0.0275 (price congestion support), then the second support level is at 0.0268 (price congestion support) and the third one at 0.025 (price congestion support).
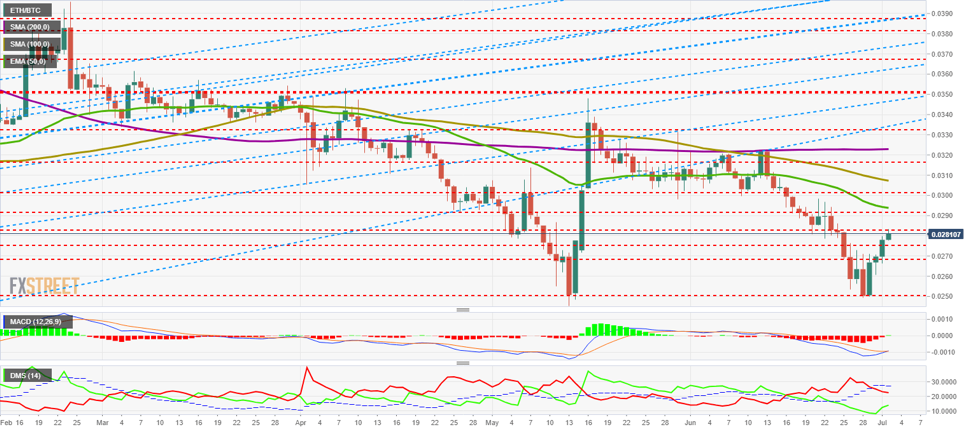
The MACD on the daily chart shows a bullish cross developing. The slope of the cut is quite aggressive and to continue in this configuration augurs substantial rises in the coming days.
The DMI on the daily chart shows how bulls react strongly to the upside while bulls lose the ADX line and end the last bearish momentum.
BTC/USD Daily Chart
BTC/USD is trading at the $10,036 price level after reaching $9.800 price congestion support.
The second support level is at $9,170 (price congestion support), and the third one at $8,772 (price congestion support).
Above the current price, the first resistance level is at $10,680 (price congestion resistance), then the second resistance level is at $11,290 (price congestion resistance) and the third one at $13,900 (price congestion resistance and relative maximum).
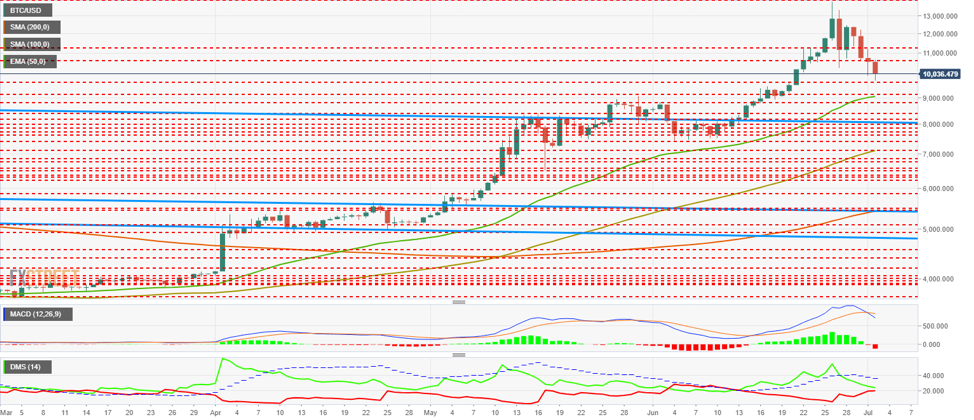
The MACD on the daily chart shows how the bearish cross accelerates and increases in both steepness and openness between lines. The scenario is one of continued bearishness with increased volatility.
The DMI on the daily chart shows how the bulls and bears are almost tied, a structure that also favors increased volatility.
ETH/USD Daily Chart
The ETH/USD pair trades at $279.9 and returns to the broad resistance range of $280 and $260.
Below the current price, the first level of support is $260 (price congestion support and EMA50), then the second at $250 (price congestion support) and the third one at $238 (price congestion support).
Above the current price, the first resistance level is at $280 (price congestion resistance), then the second at $305 (price congestion resistance) and the third at $318 (price congestion resistance).
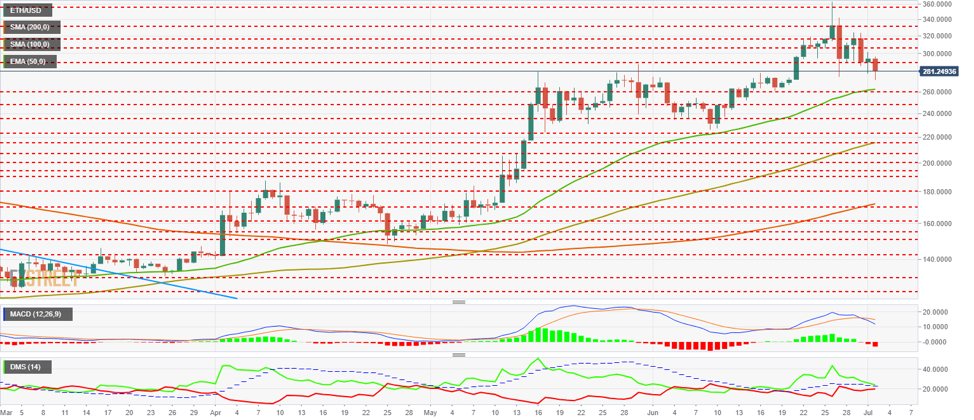
The MACD on the daily chart also shows an acceleration in the bearish cross. The structure is conducive to increased volatility.
The DMI on the daily chart shows a situation similar to that of the BTC/USD pair, although with the particularity that in ETH/USD pair the bulls remain above the ADX line, which gives an extra bullish point.
XRP/USD Daily Chart
XRP/USD is trading at $0.394 and is at times above the price congestion resistance at this level.
Below the current price, the first support level is $0.368 (double price congestion support and SMA100), then the second support level is $0.345(price congestion support and SMA200), and the third one is $0.335 (price congestion support).
Above the current price, the first resistance level is at $0.41 (price congestion resistance and EMA50), then the second at $0.428 (price congestion resistance) and the third one at $0.44 (double price congestion resistance).
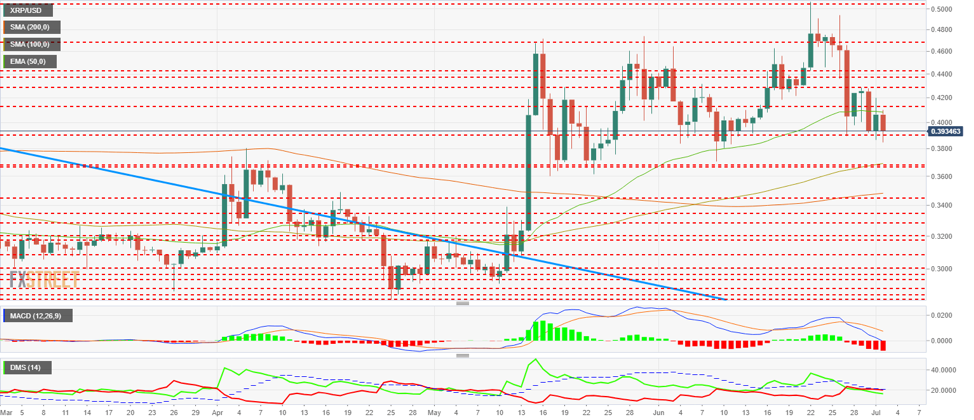
The MACD on the daily chart reaches the middle of the indicator with much openness between the lines and also a significant slope. This structure makes it difficult for the indicator to stop at this level and marks the negative zone as the most likely destination.
The DMI on the daily chart shows bulls and bears almost tied, with a small advantage for the latter.