Litecoin has been slipping this week – largely due to the continued falling Bitcoin prices which has seen the price for Litecoin fall by a total of 11% to reach where it currently trades around $121. The cryptocurrency had a fantastic run in 2019 bull run before running into strong resistance at the $145 level and rolling over to fall.
Litecoin is currently trading at support provided by a rising trend line. However, a break beneath the trend line could suggest that the market will head further lower. Still, Litecoin has now seen an amazing 65% price surge over the past 3 months which has allowed the coin’s market cap to climb to $7.45 billion – putting it in 4th place amongst the top cryptocurrencies.
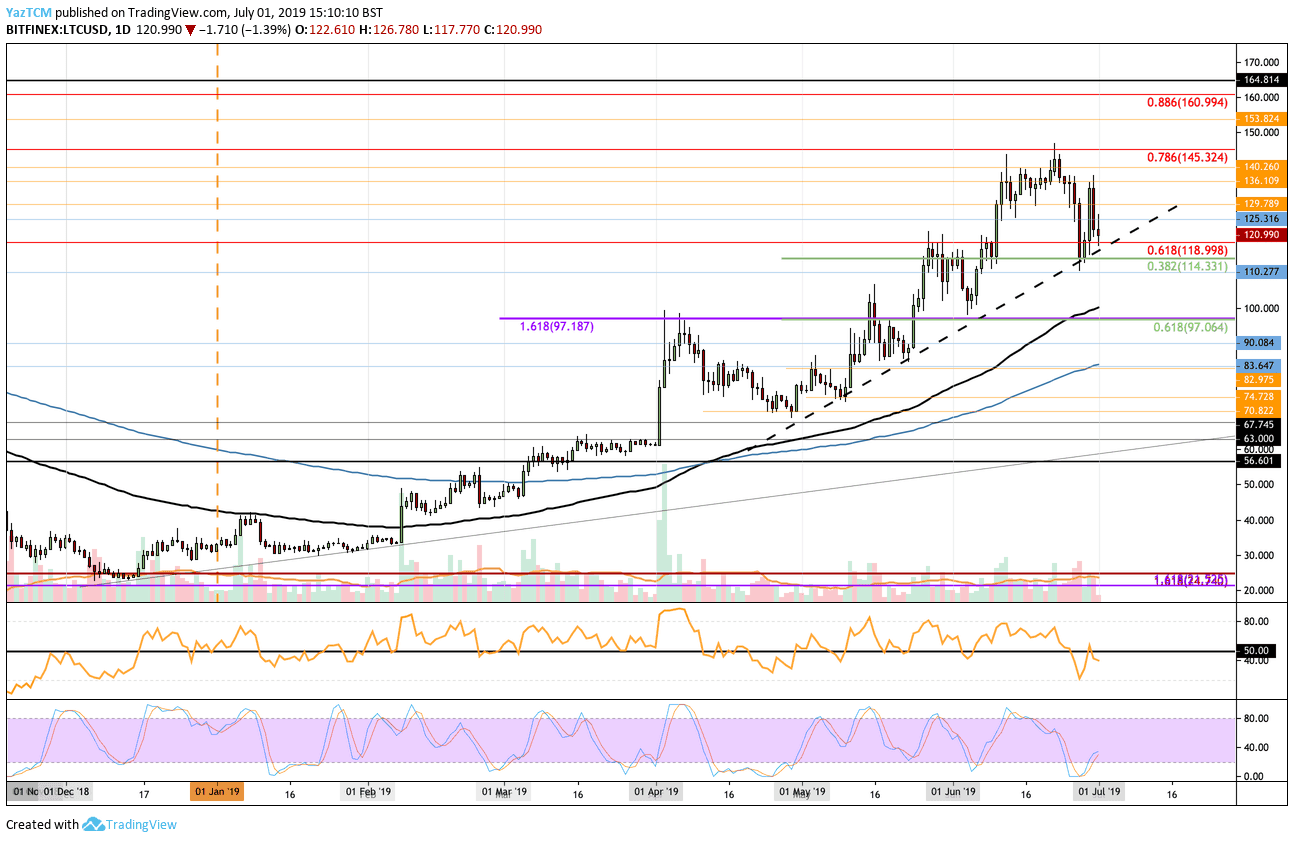
Looking at the LTC/USD 1-Day Chart:
- Since our previous Litecoin analysis, we can see that LTC continued to fall further beneath the support at the $130 level. Litecoin went on to bounce at support provided by the short term rising trend line – which was bolstered by the short term .618 Fib Retracement. The cryptocurrency has now returned to the trend line as it currently rests here for support.
- From above: The nearest level of resistance now lies at $125 and $130. Above this, higher resistance lies at $136, $140, and the previous $145 resistance level. If the bulls break above $145, further resistance is found at $150, $153, and $161 (which contains long term bearish .886 Fib Retracement).
- From below: The nearest level of support now lies at $119. If the sellers drop beneath the trend line, the next levels of support lie at $114, $110, and $110. Beneath $100, support is at $97, $90, and $84 (which contains the 200 days EMA).
- The trading volume still remains high although it is showing signs of diminishing.
- The Stochastic RSI has recently produced a bullish crossover signal in oversold conditions which had resulted in the rebound higher. If the Stochastic RSI can continue to rise higher, we can expect the coin to hold above the short term rising trend line.
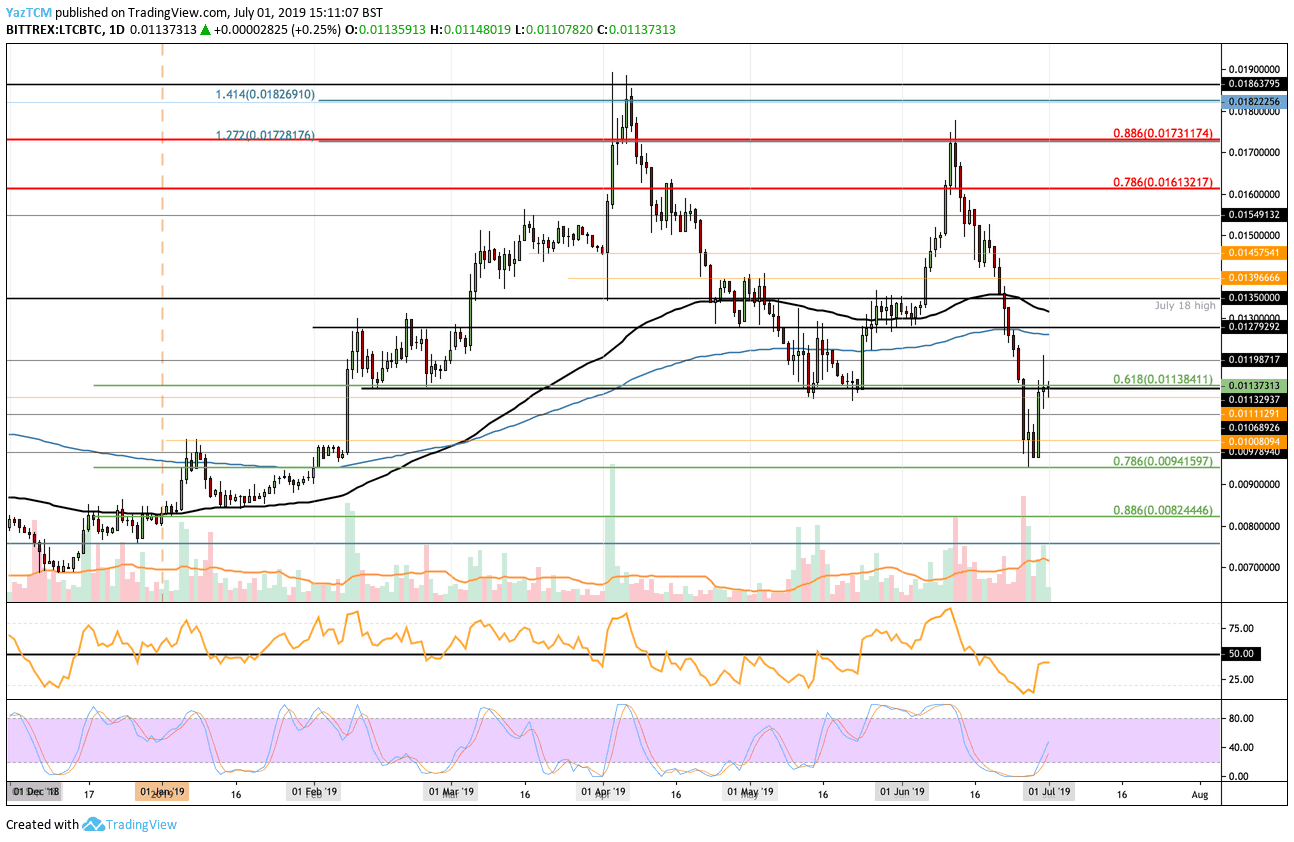
Looking at the LTC/BTC 1-Day Chart:
- Against Bitcoin, we can see that Litecoin has been suffering heavily as the market falls beneath the strong support at the 0.01138 BTC level. The coin went on to fall further until finding support at 0.0094 BTC (provided by the .786 Fib Retracement). LTC/BTC has since rebounded and it now trades at 0.01138 BTC again.
- From above: The nearest level of resistance lies at 0.012 BTC. Above this, further resistance lies at 0.0127 BTC,(200 day EMA) and 0.013 BTC (100 day EMA). If the buyers continue above 0.013 BTC, the next level of resistance lies at 0.0135 BTC and 0.014 BTC.
- From below: The nearest level of support now lies at 0.01111 BTC. Further support beneath this lies at 0.0106 BTC, 0.010 BTC and 0.0094 BTC.
- The Stochastic RSI has also produced a bullish crossover signal recently which is a promising sign for the bulls. However, to see a recovery in this coin we will need to see the RSI rise and climb above the 50 level.