Ethereum (ETH/USD)
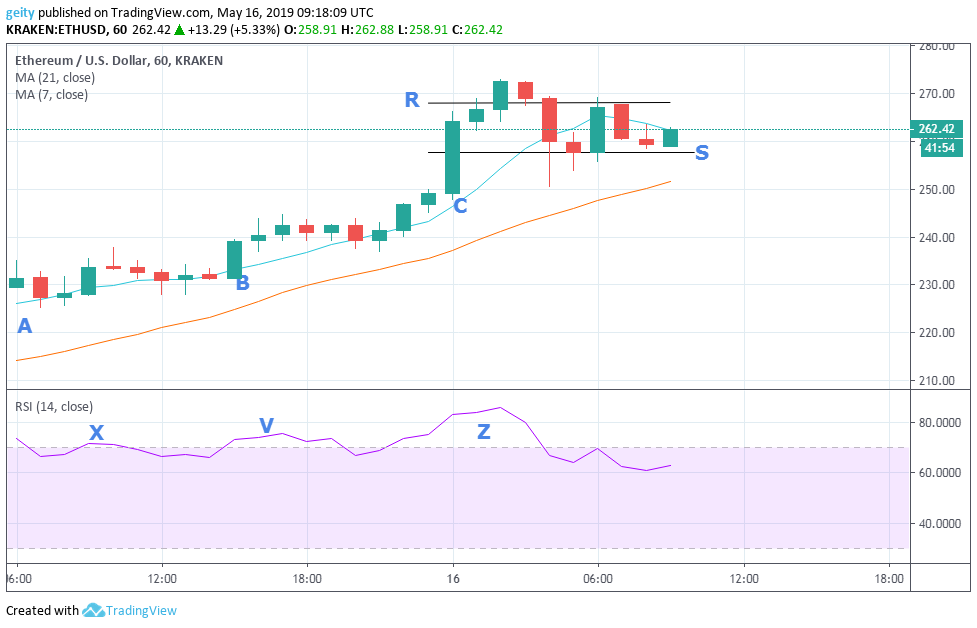
In the last 24hrs ETH/USD pair is down by 3.2%, having moved from $303.53 to the current market price of $293.74. The downtrend has been buttressed by the 21-day moving average that was seen gravitating above the 7-day moving average. The RSI indicator was seen trading between the levels of 50 and30 thus reflected a sideways price movement.
New resistance level was held at $303.77, support level was at $289.28, additionally both support, and resistance level was tested severally. At the moment, the RSI is trending flat, this indicates a loss of dominance from either buyers or sellers. The decrease in the pair’s price shows a lack of reliance on the digital asset by investors thus increase sellouts. The drop in ETH price may be due to poor liability management principles by the ICOs.
FORECAST
A more bearish rally is likely to be seen since almost all indicators point towards the downtrend. The 21 day MA is still above the 7 day MA that indicates a bearish signal. There is a higher chance the support zone will be breached, new targets should be set at $279.37.
Litecoin (LTC/USD)
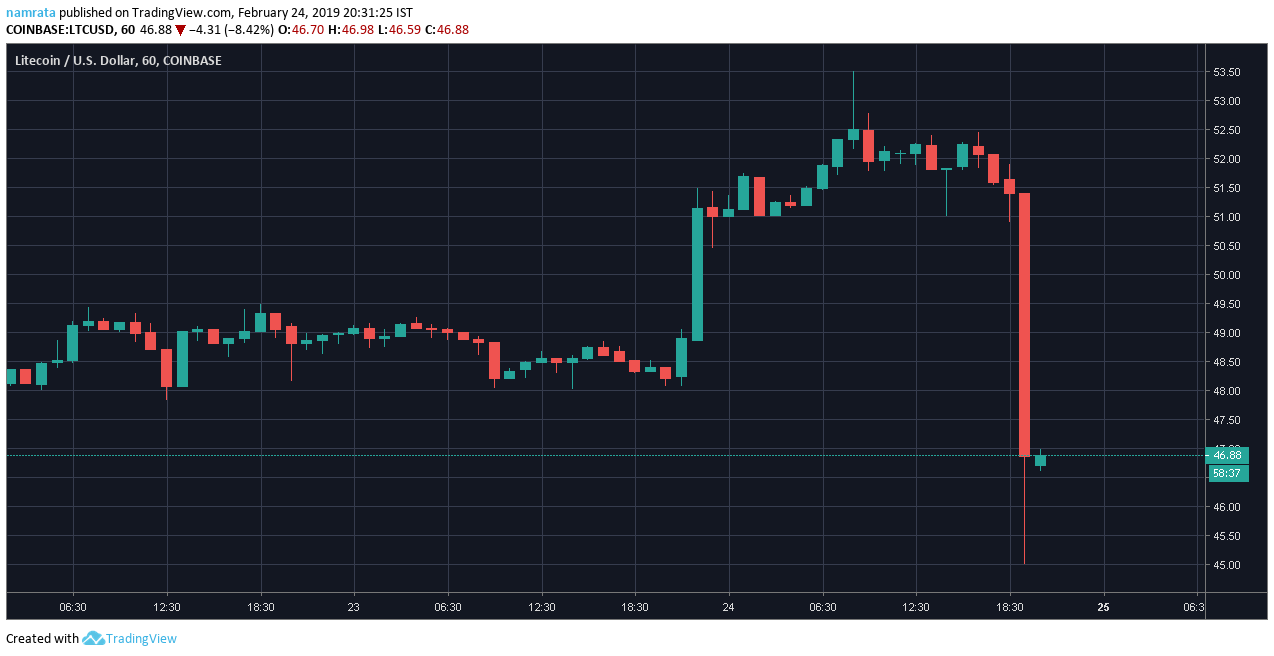
Like ETH, LTC/USD pair has been exhibiting a bearish outlook over the last 24hrs. The downward price momentum has been confirmed by the 21-day moving average that was seen above the 7-day moving average. LTC began trading at $127.77, followed by a short-term consolidation period that led to a massive fall that dipped the price momentum sharply to a low of $119.66.
This market was later on dominated by a sideways trend with short-term support and resistance defined at $121.26 and $125.22 respectively. The RSI indicator is later seen hovering between the level of 50 and 30 thus reflected a sideways price movement.
The pair’s price, later on, broke support level, which placed LTC to its current market price of $119.25. Meanwhile, the RSI is heading south, which indicates an increase in sellouts. The drop in the pair’s price has negatively affected investor’s sentiments.
FORECAST
More bear market is to be expected, this is because the 21 day MA is still above the 7-day MA. The RSI indicator is also heading south which reflects a downtrend. New targets should be set at $115.38.
Steller (XLM/USD)
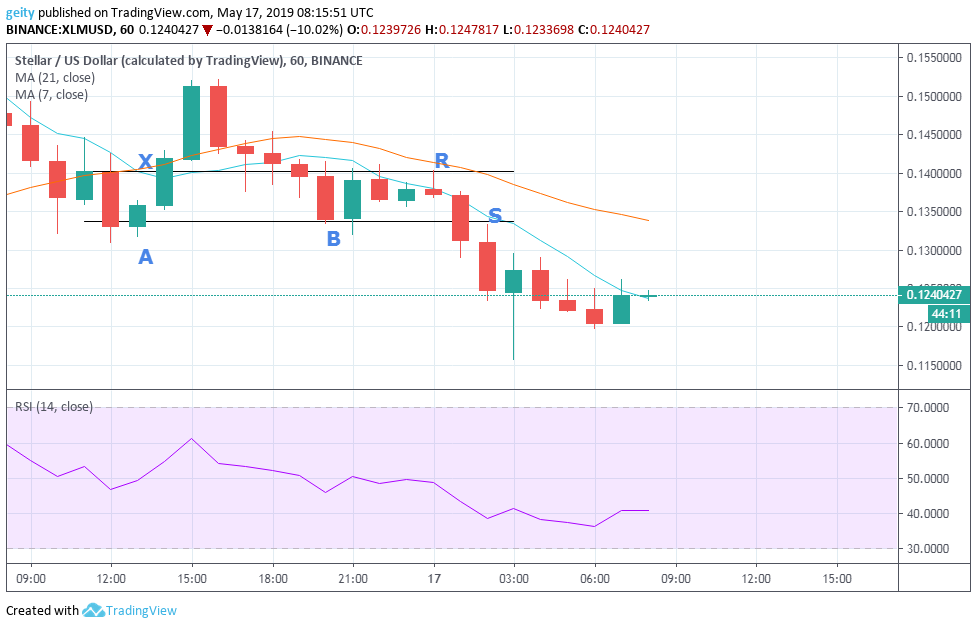
XLM market seems to have been dominated by a ranging trend that has been confirmed by the horizontal channels. This placed resistance level at $0.11016 and support level at $0.10437. The moving average has also been intertwined, which indicated a lack of momentum in the market.
XLM is down by 4.0% in the last 24hrs, having moved from $0.10950 to $0.10517. Relative Strength Index is currently trading flat, this shows that the market is likely to continue lacking momentum.
FORECAST
At the moment, the 21-day MA has crossed over the 7 day MA, this indicates a bearish signal. Further price drop should be expected. New targets should be set at $0.10324 and a stop-loss slightly below in case of a breakout.
Images Are Courtesy Of TradingView.