New Economy Movement (NEM) is a decentralized ecosystem that uses blockchain and cryptography for individuals and institutions. It is a native currency of the NS1 blockchain. And, NS1 works similar to bitcoin. It also has different nodes that store transaction data and records public ledger on “blockchain.” Let us look at the technical analysis of XEM.
Past Performance
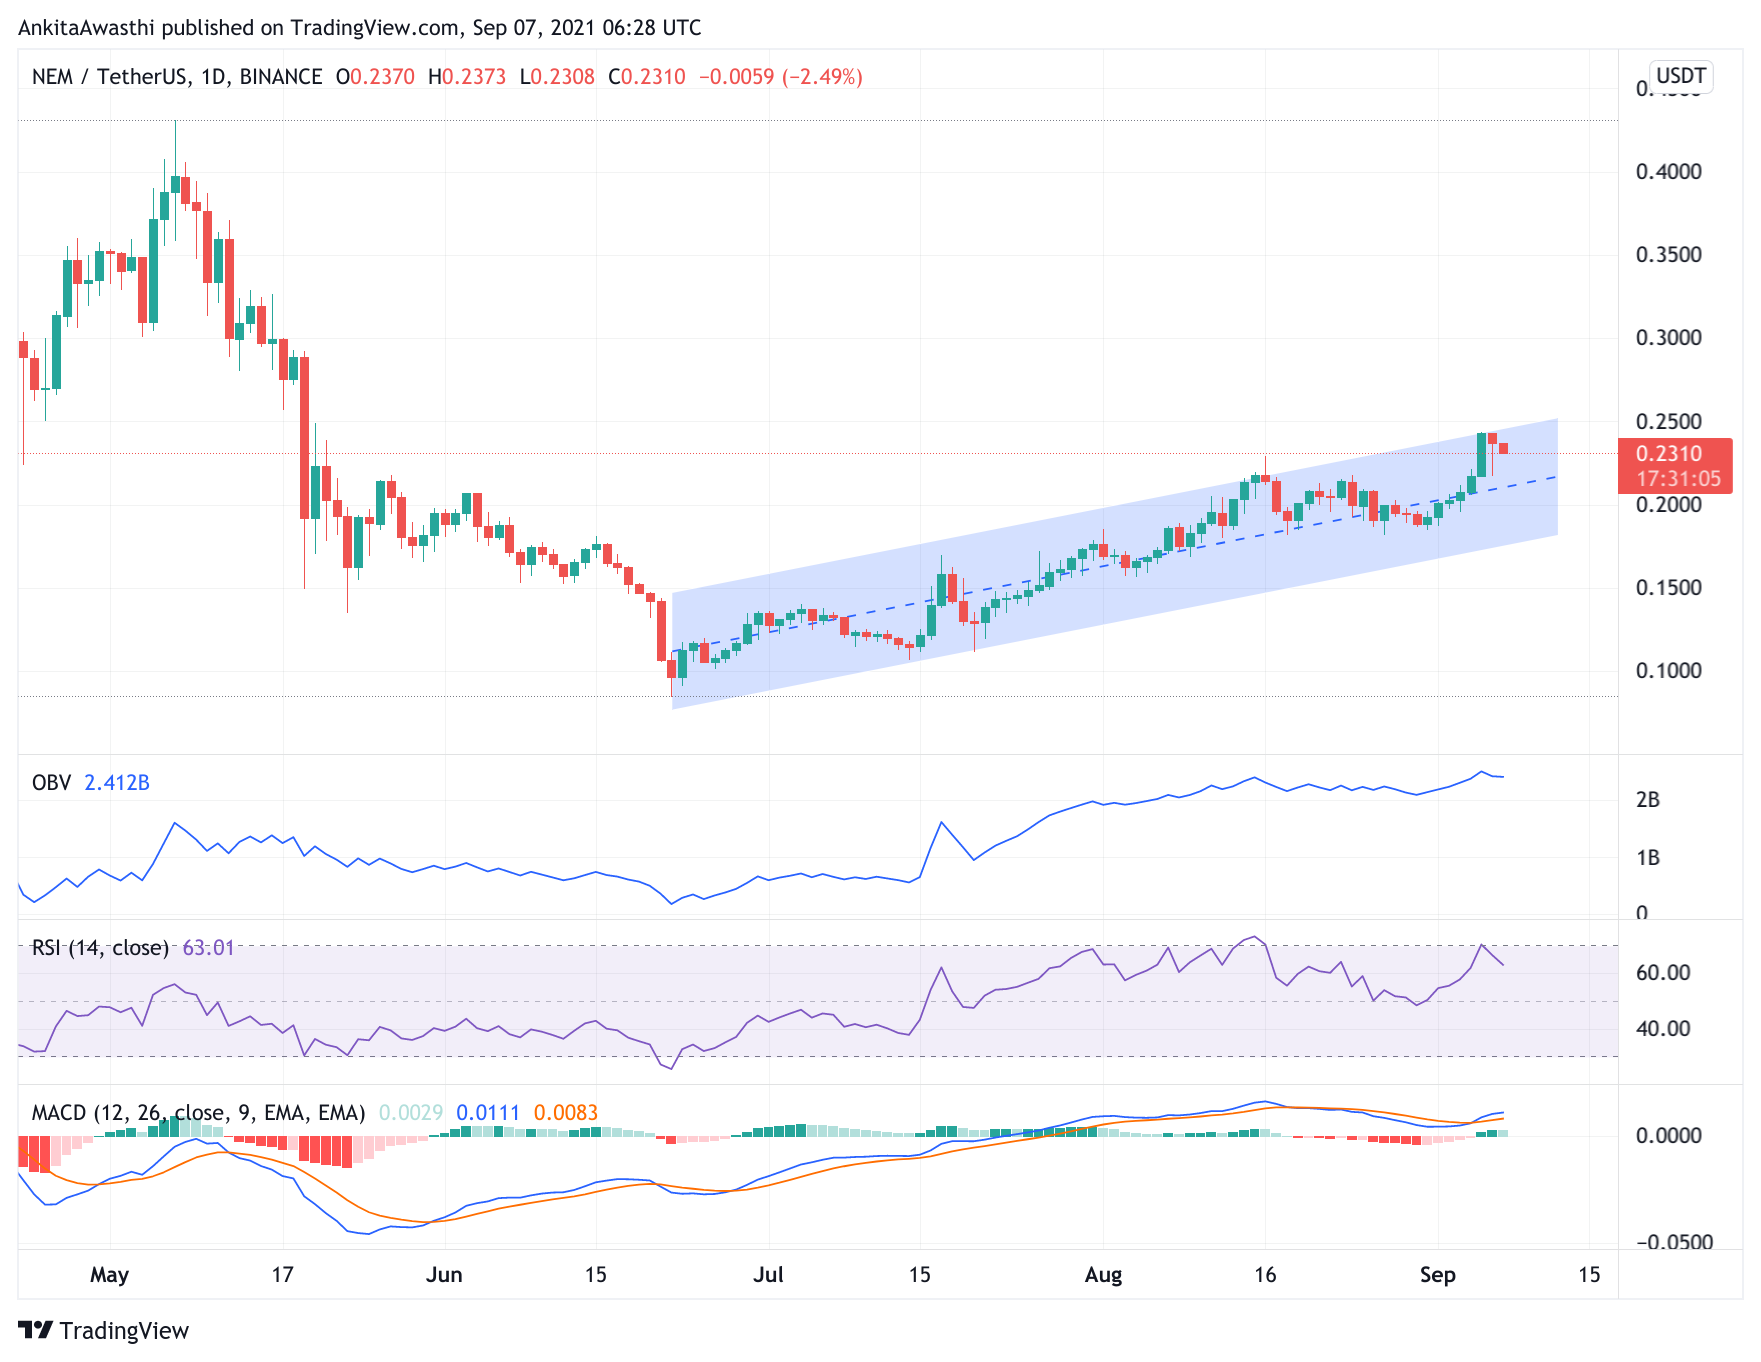
On August 31, 2021, XEM opened at $0.188. On September 06, 2021, XEM closed at $0.237. Thus, in the past week, the price has not moved by a lot. In the last 24 hours, XEM has traded between $0.221-$0.242.
https://www.tradingview.com/x/M6oAb0Su/
Day-Ahead and Tomorrow
The MACD and signal lines are above the zero range, thus suggesting traders to buy. Moreover, a bullish crossover by the Signal line over the MACD line has occurred. Thus, the overall market momentum looks bullish. Hence, the price may rise further. Since the MACD lines are near zero range, we can not rule out the possibility of the trend reversal.
Currently, the RSI indicator is at 60.90%. It faced rejection from 69.64% and fell to this level. Thus, selling pressures are slowly mounting. We have to wait and watch if buying pressures become strong enough to bring about a bearish trend reversal.
On the daily chart, the OBV indicator is in a constant range. Thus, it seems that selling volumes are being locked in.
In short, when we look at all three oscillators, we can say that the XEM price may continue to fall for the rest of the day. However, we cannot rule out the possibility of a trend reversal. We have to wait and watch if an intermittent price rise is a corrective action or the beginning of a positive trend.
XEM Technical Analysis
Currently, the XEM price is below the second Fibonacci pivot point of $0.265. If the bears remain strong till day end, then the price is likely to fall below the first and second support levels of $0.230 and $0.226, respectively.
However, if the price increases, it will break the immediate resistance level of $0.241. Post which, it will highlight the next resistance level at $0.266. As a result, traders can take a long position accordingly.