Crypto Twitter gossip has been in overdrive lately with speculation on the future of Binance Coin (BNB). But are the concerns justified? Is BNB the next FTX?
The cryptocurrency market is in a long-term bear market, and the collapse of more projects, exchanges and platforms only deepens the potential bottom.
The crash of Terra LUNA in May 2022 and the bankruptcy of FTX in Nov. drove Bitcoin (BTC) and the cryptocurrency market to lows that no one even expected last year.
On this wrecked battlefield, one figure and his project seem to remain unaffected – Changpeng Zhao (CZ) and Binance Coin. CZ is positioning himself as the only legitimate defender of the cryptocurrency sector, setting up the SAFU cryptocurrency fund among a series of initiatives. It is intended to target individuals and institutions harmed by the crashes of big crypto brands.
On the other hand, CZ is increasingly left involved in verbal jousting with founders of other exchanges, deleting tweets that attacked competitors or transferring large numbers of tokens between wallets. It is enough to mention that the collapse of FTX was preceded by a direct skirmish between SBF and CZ.
In this context, the price action of the exchange’s native token, Binance Coin (BNB) since 2021, is as impressive as it is thought-provoking. Crypto Twitter recently highlighted several anomalies around the Binance ecosystem and BNB price action.
Indeed, it appears that the BNB token’s unnatural rise has continued uninterrupted since the beginning of the bull market, while the bear market has only strengthened its valuation against Bitcoin. Is Binance on the brink of a precipice caused by the overleveraging and manipulation of its native token?
BNB Price Action
Binance Coin is currently the 4th largest cryptocurrency after BTC, ETH and USDT with a market capitalization of $46.3 billion, according to CoinMarketCap. Looking at Binance Coin price action since the beginning of 2021, we see a huge surge from Jan. to May 2021. During last year’s bull market, BNB grew by some 2,100% from $32 to the all-time high (ATH) of $704.6.
Interestingly, six months later, in Nov. 2021, the BNB price failed to break through the ATH and hit a peak at $696.1. After forming a long-term double peak pattern, the Binance Coin price started a bear market.
The current low was reached in mid-June 2022 at $183.4. This is equivalent to a decline of 73.5% from the Nov. peak. There has been about six months of consolidation since the June low, and Binance Coin is trading in the $290 area today.
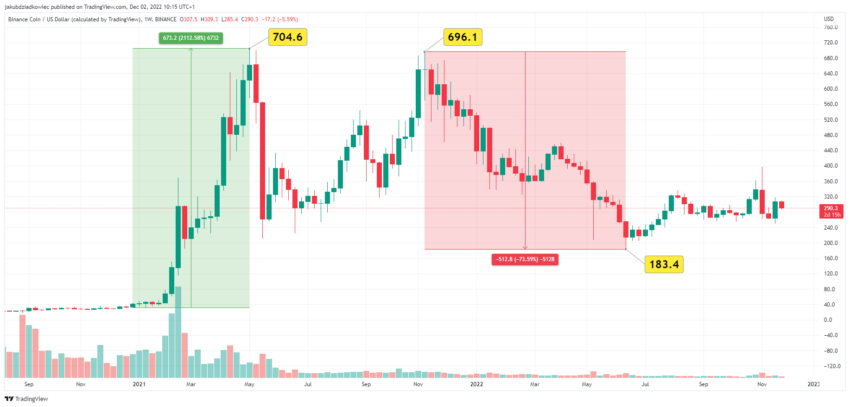
Thus, we can see that the price action of BNB/USDT follows a pattern we recognize throughout the broad cryptocurrency market: exponential increases during a bull market and severe declines during a bear market.
What sets Binance Coin apart from other altcoins is the depth of the declines. Indeed, it turns out that the 73.5% drop below ATH is far smoother than in all major cryptocurrencies.
We only need to point to Ethereum, which lost 82% of its value measured from the ATH to the June low of $881. After that, XRP fell by 85%, Dogecoin (DOGE) by 93% and Cardano (ADA) by 90%. Even Bitcoin is losing ground against Binance Coin, as the cryptocurrency leader has so far lost 77% of its value from ATH at $69,000.
Binance Coin Reaches ATH in Bitcoin Pair
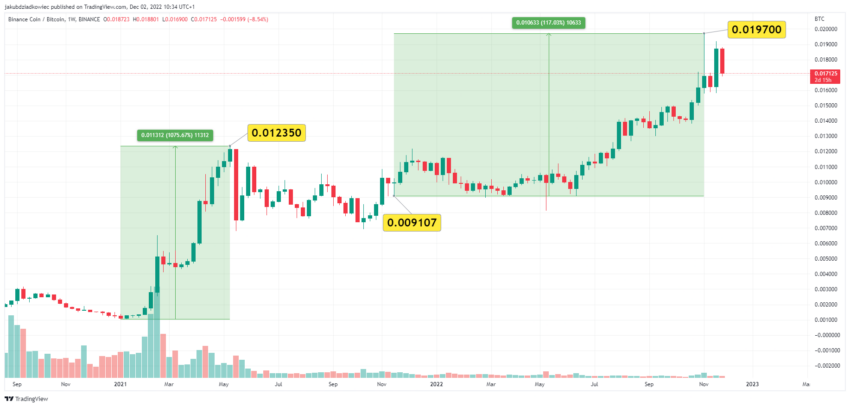
Due to the latter fact, the price of BNB has regularly reached ATH against the price of BTC since mid-2022. If you look at the long-term chart of BNB/BTC since the beginning of 2021, you get the impression that there was no bear market here.
And indeed, if there were any declines, they did not exceed 45%. On the other hand, the increase in the value of BNB relative to BTC is impressive. First, since the beginning of 2021, the price of BNB rocketed from a low of 0.00100 BTC to a peak of 0.01235 BTC, recording a 1,075% gain in the pair to the largest cryptocurrency.
It then had a correction that ended shortly before the start of a broad crypto bear market. When Bitcoin reached its ATH in Nov. 2021, the price of BNB was 0.00911 BTC. However, just a year later, in Nov. 2022, Binance Coin recorded a new all-time high of 0.01970 BTC. The native Binance token increased by 117% to Bitcoin during a bear market that has lasted for a year.
Will BNB End up Like FTT?
These impressive gains and the somewhat unnatural price action of Binance Coin were recently brought to the attention of cryptocurrency market analyst @DylanLeClair_. He published a series of tweets in which he ponders the reasons for such performance of the Binance token. At the beginning of his thread, he wrote ironically:
“Label me a pessimist, but all I see is a whole lot of hot air. (…) Must be a ‘new paradigm’.”
He then compared the BNB and FTT charts from 2020-2021, both of which had about a year’s accumulation, followed by an exponential price breakout in early 2021. And again, he writes piercingly:
The analyst goes on to point out that, indeed, during last year’s bull market, many altcoins outperformed Bitcoin and experienced larger increases. Among the biggest “winners” of that period, he lists: “SOL (Alameda leverage and fraud), AVAX (3AC), LUNA (perpetual motion machine).”
He concludes that all such actions are “an attempt at modern alchemy” and the creation of tokens based on thin air. The recipe is simple: create a token, use capital and marketing in an illiquid market, and dress everything up in a slick narrative.
Binance Coin Price: Spot vs. Futures
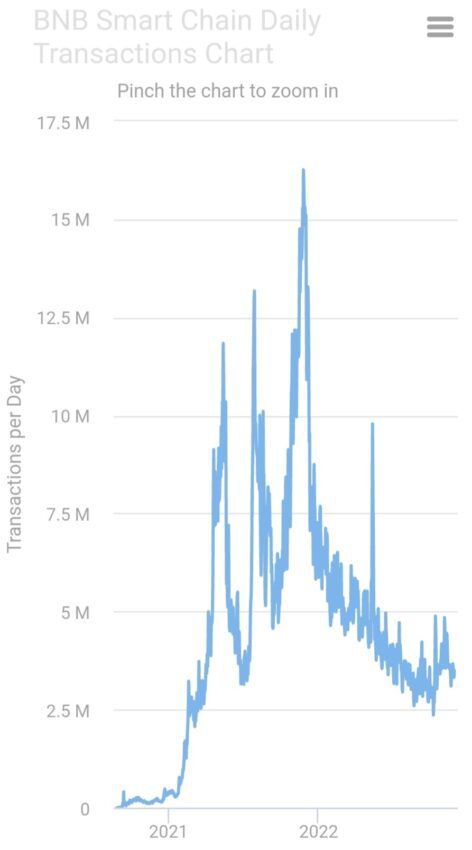
In response to this thread on Twitter and in a sort of defense of the Binance ecosystem, another analyst @MatthewHyland_ pointed out its trading activity. Indeed, the BNB Smart Chain’s trading activity chart has been steadily declining since Nov. 2021. At the recent low, the decline was about 80% from last year’s peaks.
However, this does not change the narrative around the Binance ecosystem. BNB continues to hit the preferences of traders and investors. This is illustrated by another argument from @DylanLeClair_ about the possible overleveraging of BNB.
He juxtaposed two charts of the BNB price with marked VPVR (Volume Profile Visible Range) levels. This indicator compares the price levels with their trading volume. In the BNB/BTC spot market the chart has the largest support levels near 2020 prices – before the exponential breakout.
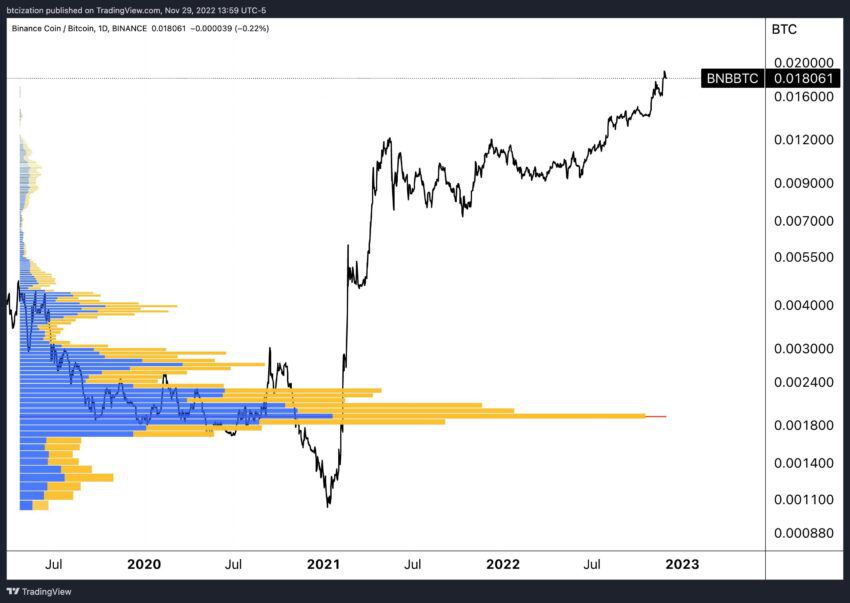
However, looking at the perpetual futures contracts for BNB, the situation is exactly the opposite. Leveraged traders have generated huge volume in the high price areas reached from mid-2021 until now.
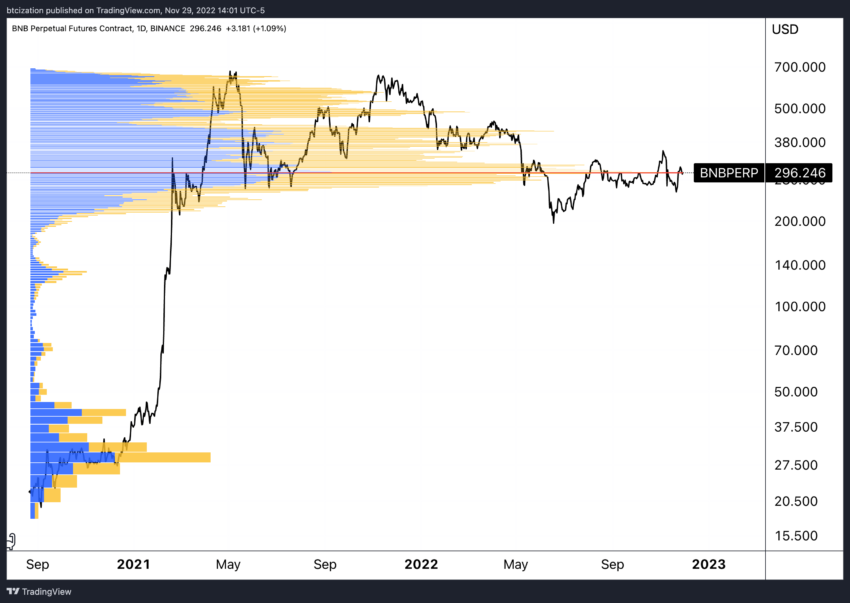
According to the analyst, this is evidence of a massive overleveraging of the BNB/USDT pair and could signal trouble ahead. If this were to happen and the price of Binance Coin were to collapse, the entire cryptocurrency market also collapse. BNB is currently the fourth largest cryptocurrency, while stablecoin BUSD ranks sixth with a market capitalization of $22 billion.
Disclaimer: BeInCrypto strives to provide accurate and up-to-date information, but it will not be responsible for any missing facts or inaccurate information. You comply and understand that you should use any of this information at your own risk. Cryptocurrencies are highly volatile financial assets, so research and make your own financial decisions.