With the rising influence of selling pressure as indicated by the technical analysis of ROSE, the token struggles to contain the pronged bearish momentum as prices struggle to reach $0.050. Oasis Network (ROSE) struggles to reverse the bearish momentum since the last month which accounted for over a 28.2% drop in the prices, declining from $0.070 to the low of $0.042. Even after consolidating between the range of $0.047 and $0.044 for the last 20 days, traders could not take the prices above the resistance of $0.050. Registering a drop of 3.04% in the last 24 hours, the token is currently trading at $0.045. The market valuation which slid by 3.35% to $575.29% million along with a surge of 67.59% in the trading volume due to high selling pressure highlights the strong bearish influence on the market. Key Points
- The ROSE price action displays a fall of 3.04%
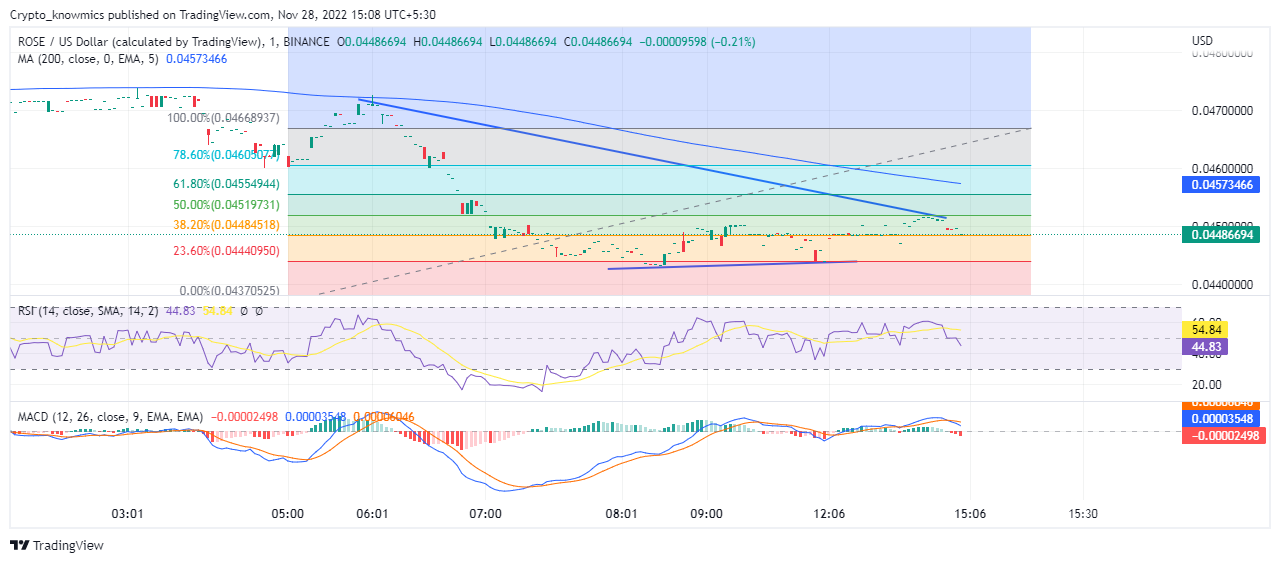
- A significant drop below 200-day EMA highlights the steep downtrend
- The intraday trading volume in ROSE is $23.24 million
 Source: Tradingview
ROSE Technical Analysis
Trading below the crucial resistance level of $0.050 since November 11, the ROSE does not show signs of a bullish reversal as the market is still in the correction phase. After recent consolidation, the prices again plunged below the 200-day EMA owing to a selling spree in the market. The ascending triangle pattern formed by the resistance and support trendline with the base at $0.044 signal another round of a bearish cycle. A sharp decline in ROSE prices below 38.20% on the Fibonacci retracement level from 100% with a support line coinciding with the 23.60% reflects the intensity of bearishness in the market. Any breakout from the current price level will be coupled with buying opportunities for the traders if prices break above the $0.050 mark. Nonetheless, a slight drop in the prices can trigger a selling spree in the market.
Technical Indicators
Moving sideways along the mean point, the RSI makes a bearish divergence and crossover under the 14-day SMA. While MACD turning bearish after making a bearish divergence on a bearish histogram also reflects a lack of bull in the market. According to the technical indicators, the ROSE is going through strong bearish momentum as sellers are overly active since prices plunged below the $0.050 mark.