Polygon (MATIC) is a well-structured network that provides an easy-to-use platform for Ethereum. The core components used are Polygon SDK that supports multiple application mechanisms. Polygon is a layer2 scaling solution, it aims to make cryptocurrencies widely accepted. Let us look at the technical analysis of MATIC.
Past Performance
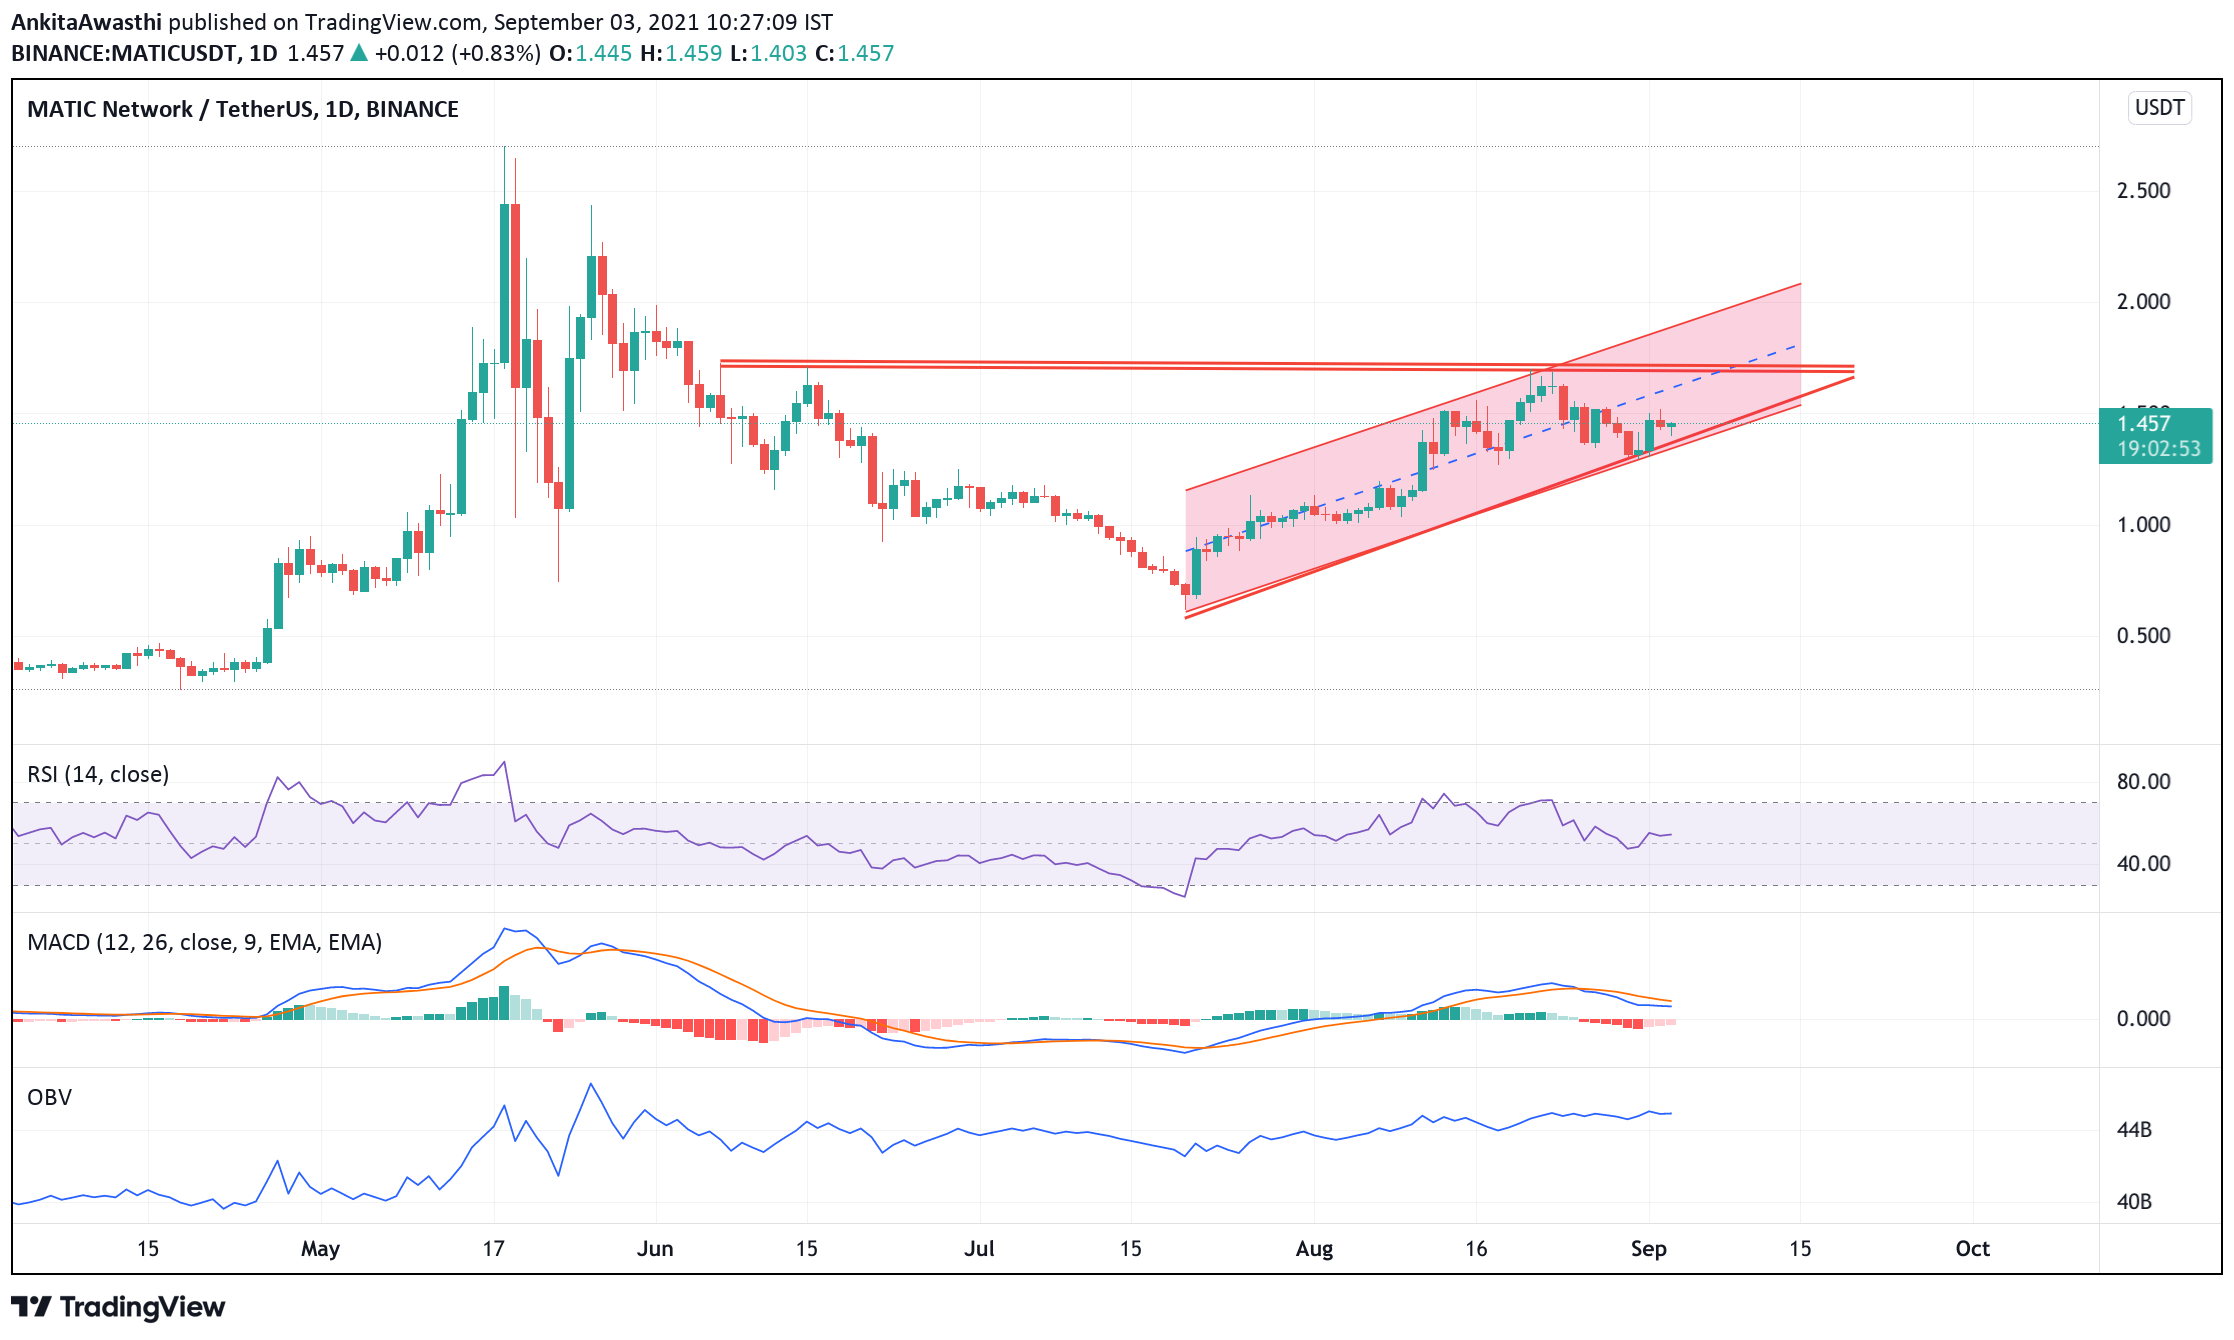
On August 27, 2021, MATIC opened at $1.37. On September 02, 2021, MATIC closed at $1.45. Thus, in the past week, the MATIC price has not moved by a lot. In the last 24 hours, MATIC has traded between $1.41-$1.52.
https://www.tradingview.com/x/L3n4uJFf/
MATIC Technical Analysis
After Polygon released news about acquiring Layer 2 blockchain Hermez for $250 million. The price shot up to its long-term resistance at $1.7. However, the price could not break the resistance level and fell back to its immediate support level.
MATIC is still trading as per the trendline, which is in the upward direction. Therefore, after taking support of the trend line, we can expect it to break the long-term resistance level as well.
The MACD and signal lines are above the zero range, thus suggesting traders to buy. However, a bearish crossover by the MACD line over the signal line has occurred. Thus, the overall market momentum looks bearish. Hence, the price may go down further. Since the MACD lines are near zero range, we can not rule out the possibility of the trend reversal.
Currently, the RSI indicator is at 57.90%. It faced rejection at 46.64% and rose to this level. Thus, buying pressures are slowly mounting. We have to wait and watch if buying pressures become strong enough to bring about a bearish trend reversal.
On the daily chart, the OBV indicator is upward sloping. Thus, buying volumes are higher than selling volumes. High buying activity will exert upward pressure on the MATIC price.
In short, when we look at all three oscillators, we can say that the price may continue to rise. However, we cannot rule out the possibility of a trend reversal. We have to wait and watch to see if an intermittent price rise is a corrective action or the beginning of a positive trend.
Day-Ahead and Tomorrow
Currently, the price is below the second Fibonacci pivot point of $1.51. If the bears remain strong till day end, then the price is likely to fall below the first, and second, support levels of $1.35, and $1.26, respectively.
The price is trading below the 38.2% FIB retracement level of $1.68. It may soon fall below the FIB retracement level of $1.42. Thereafter, we have to wait and watch if the price retests and breaks out of these levels. In that case, the price upswing is likely to continue tomorrow as well.
However, on the upside, if the resistance of level $1.52 is broken, it will highlight the next resistance at $1.68, which can be kept as the target for the long call.