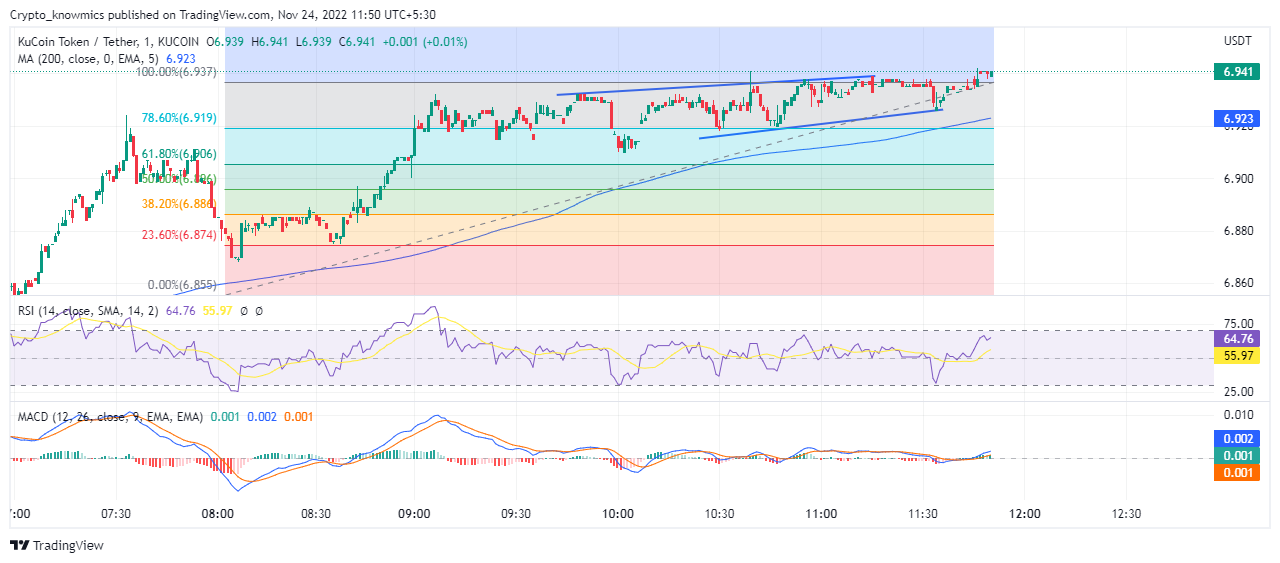
The KCS technical analysis shows that the token moves sideways while breaching the 200-day EMA significantly, eyeing to break above the mark of $7, with rising demand among buyers. KuCoin Token (KCS) price action displays the continuation of a bullish recovery, signaling another bullish breakout while moving sideways above $6.90. During the recent crypto collapse in the second week of November, KCS plummeted below the mark of $6 from the psychologically important level of $10. The drop accounted for a drop of 8.8% over the last 14 days. However, the token quickly consolidated between the range of $6.97 and $6.39, while signaling strong momentum to break above the mark of $7 again, despite moving sideways.
Key Points
- KCS gains bullish momentum with prices moving above 200-day EMA
- The daily chart shows a sideways uptrend with prices teasing to break above $7
- With a rise of 10%, the intraday trading volume in KCS is $1.58 million
 Source: Tradingview
KCS Technical Analysis
With a growth of 3.4% in the last 24 hours, the market valuation of KCS rose by 3.83% to reach $680.10 million. Additionally, the jump of 10% in 24-hour trading volume to $1.58 million supports the uptrend in the market. Even though the market is characterized by a sideways trend, the 200-day EMA moving below the prices signals a possible bullish breakout. As the KCS market continues to move sideways despite uptrend momentum, the sideline traders must identify horizontal price channels or wait for a breakout for entries and exits. They can also put a stop loss below and above the resistance and support levels respectively to make profits.
Technical Indicators
Approaching the overbought zone while challenging the 14-day SMA, RSI makes a steep jump above the halfway line after narrowly escaping the oversold boundary. Moving sideways, the MACD also signals an upswing, giving a crossover at the midpoint on a bullish histogram. According to the technical indicators, there is a spike in demand among buyers as KCS rebounds from the recent drop while MACD is set for another round of upswing.
 cryptoknowmics.com