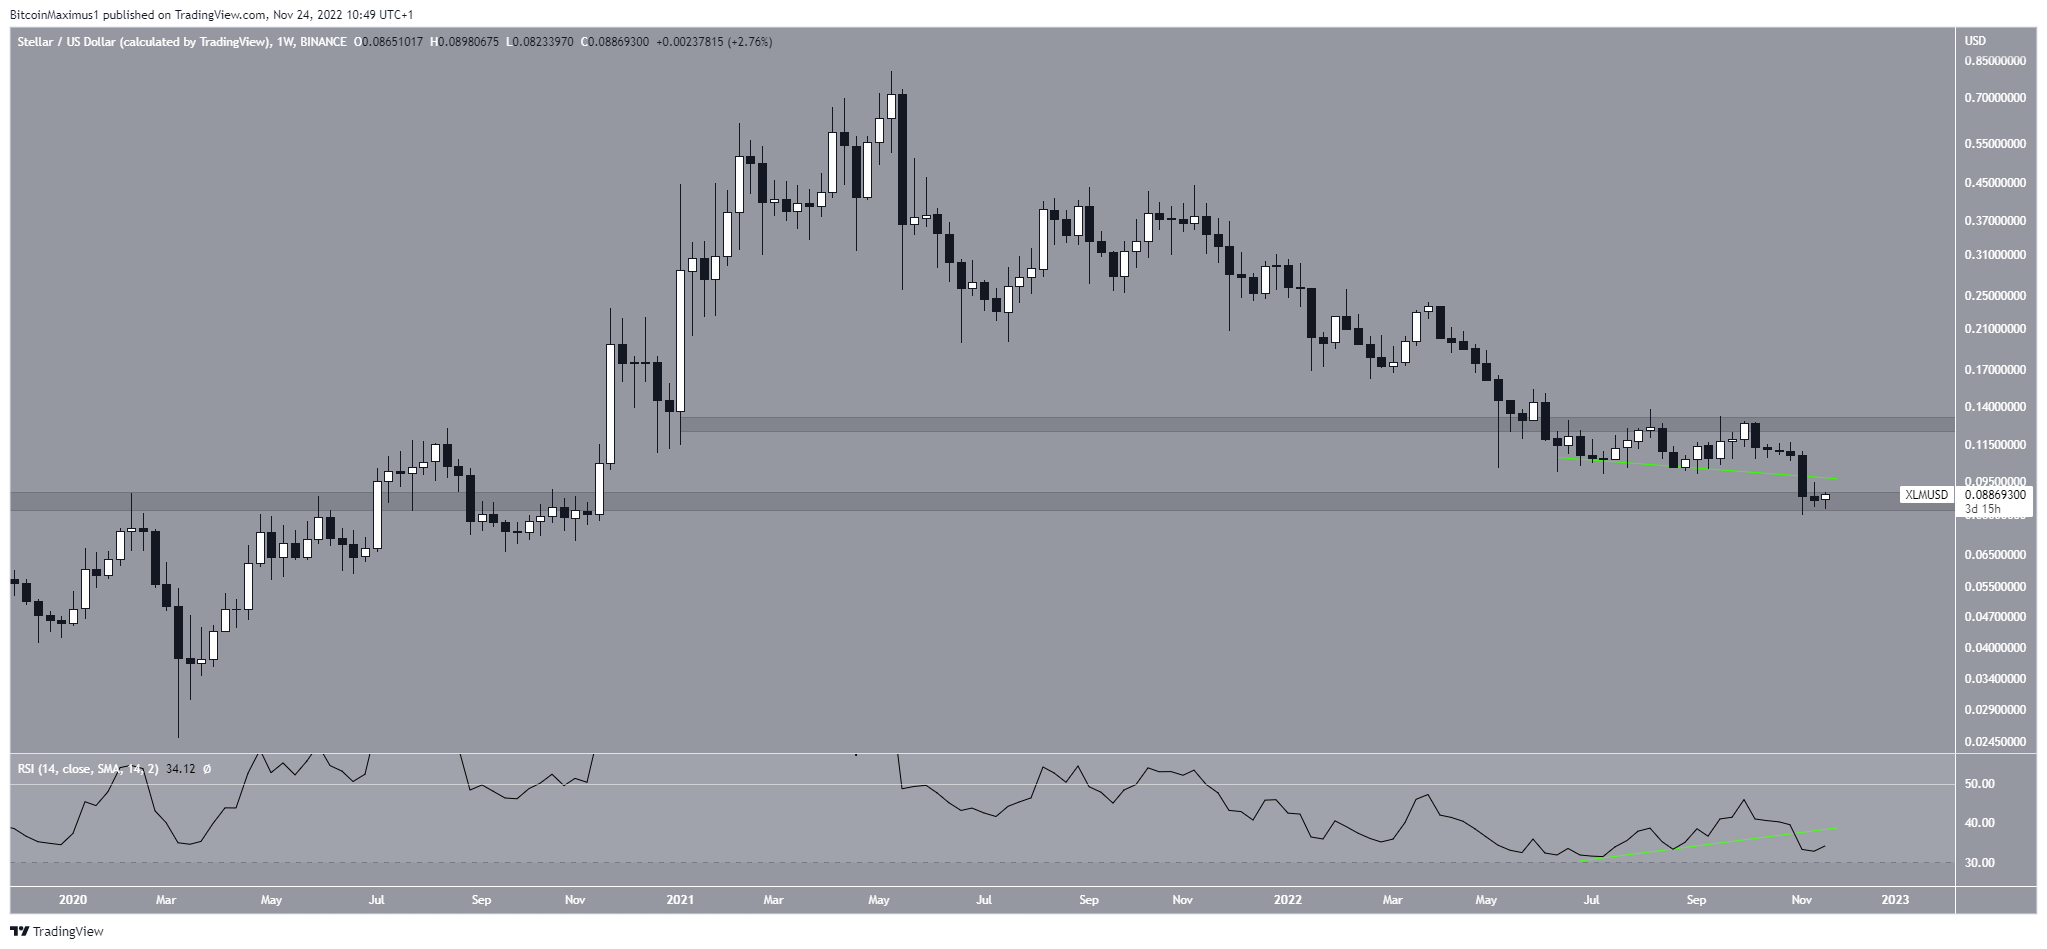
The Stellar Lumens (XLM) price is trading inside a long-term range between $0.085 and $0.127. There are conflicting readings between technical indicators and the wave count.
XLM is the native token of the Stellar network. The XLM price has fallen since reaching a high of $0.80 in May 2021. The downward movement led to a low of $0.081 in Nov. 2022.
Now, the XLM price is trading inside the $0.085 support area. The primary resistance is at $0.127.
Even though the Stellar price is trading inside support, technical indicator readings are bearish. This is especially visible in the weekly RSI, which has broken down from its bullish divergence trend line (green).
As a result, the weekly time frame readings are insufficient in predicting the future trend’s direction.
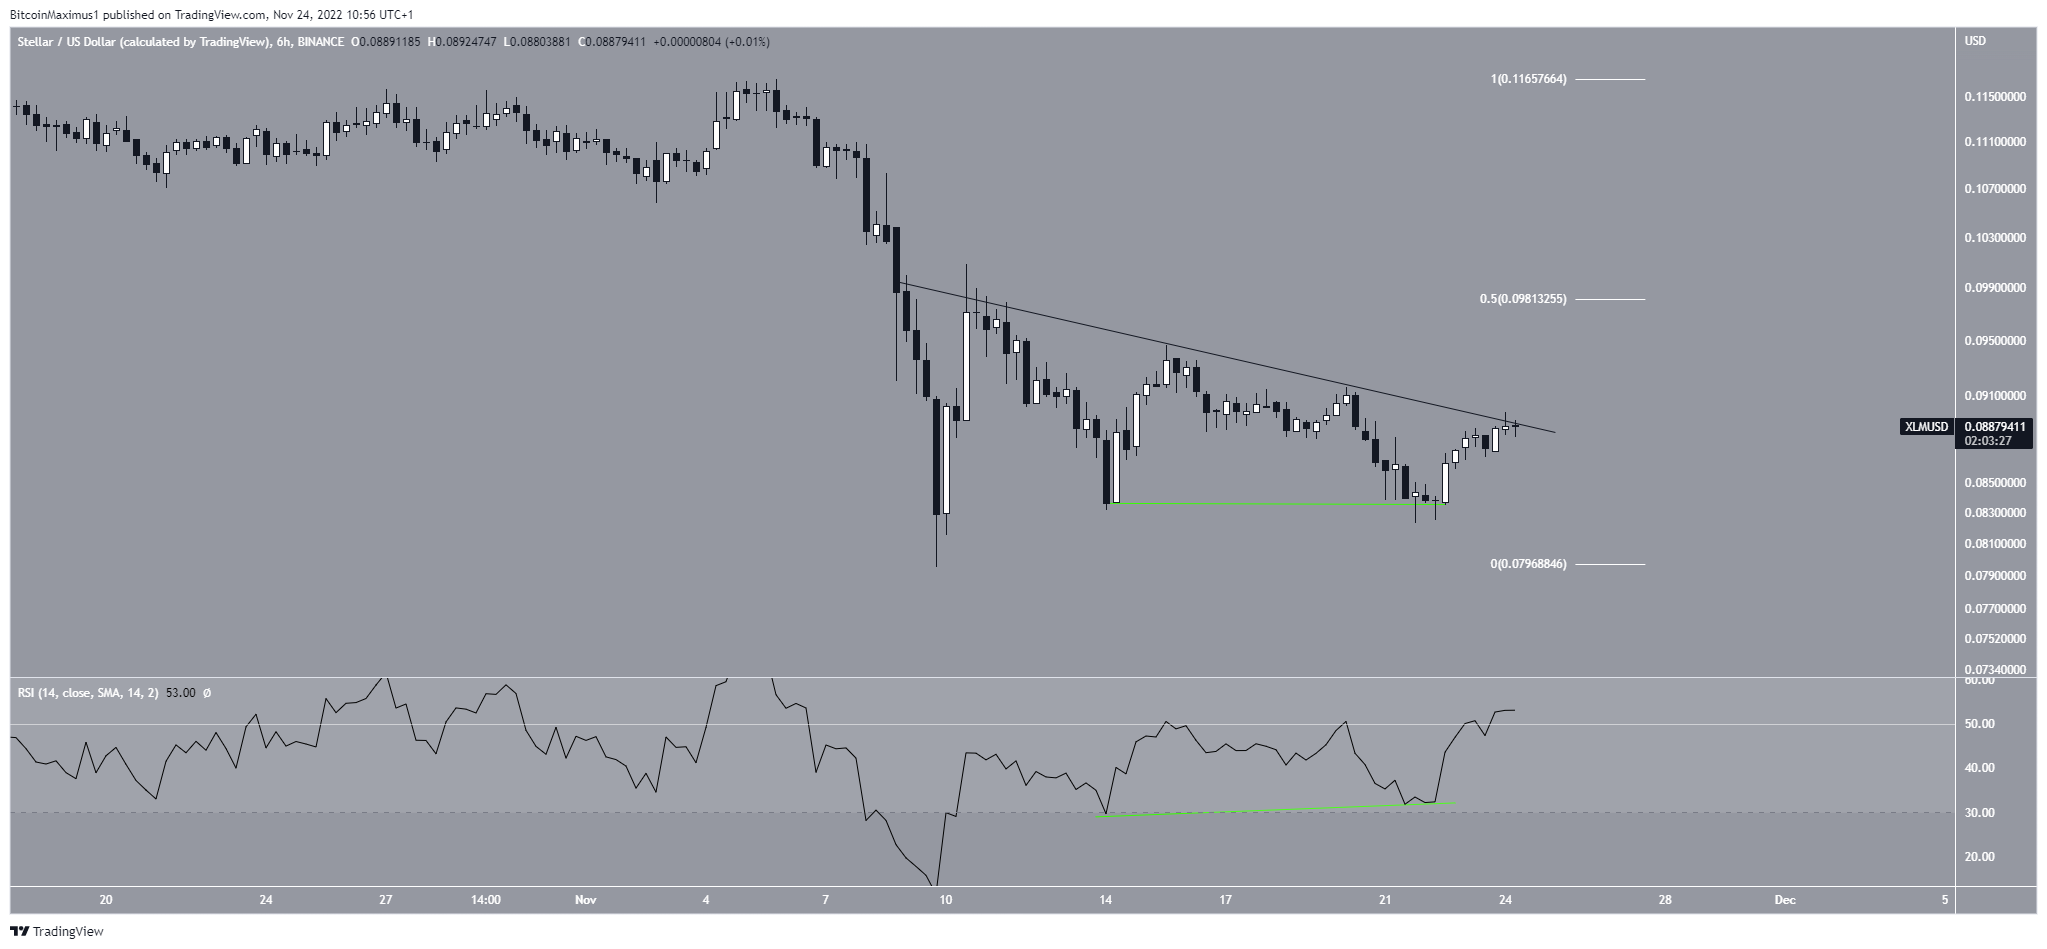
Short-Term Stellar Price Resistance
The short-term six-hour chart is more bullish than its weekly counterpart. It shows that the XLM price generated bullish divergence, preceding the current upward movement. Now, it has reached a descending resistance line in place since Nov. 8.
The Stellar price made several unsuccessful attempts at breaking out over the past 24 hours. In any case, lines get weaker each time they are touched. As a result, an eventual breakout seems likely.
In that case, the Stellar price could increase to $0.098, the 0.5 Fib retracement resistance level. Reclaiming that area would take it to the long-term resistance at $0.127.
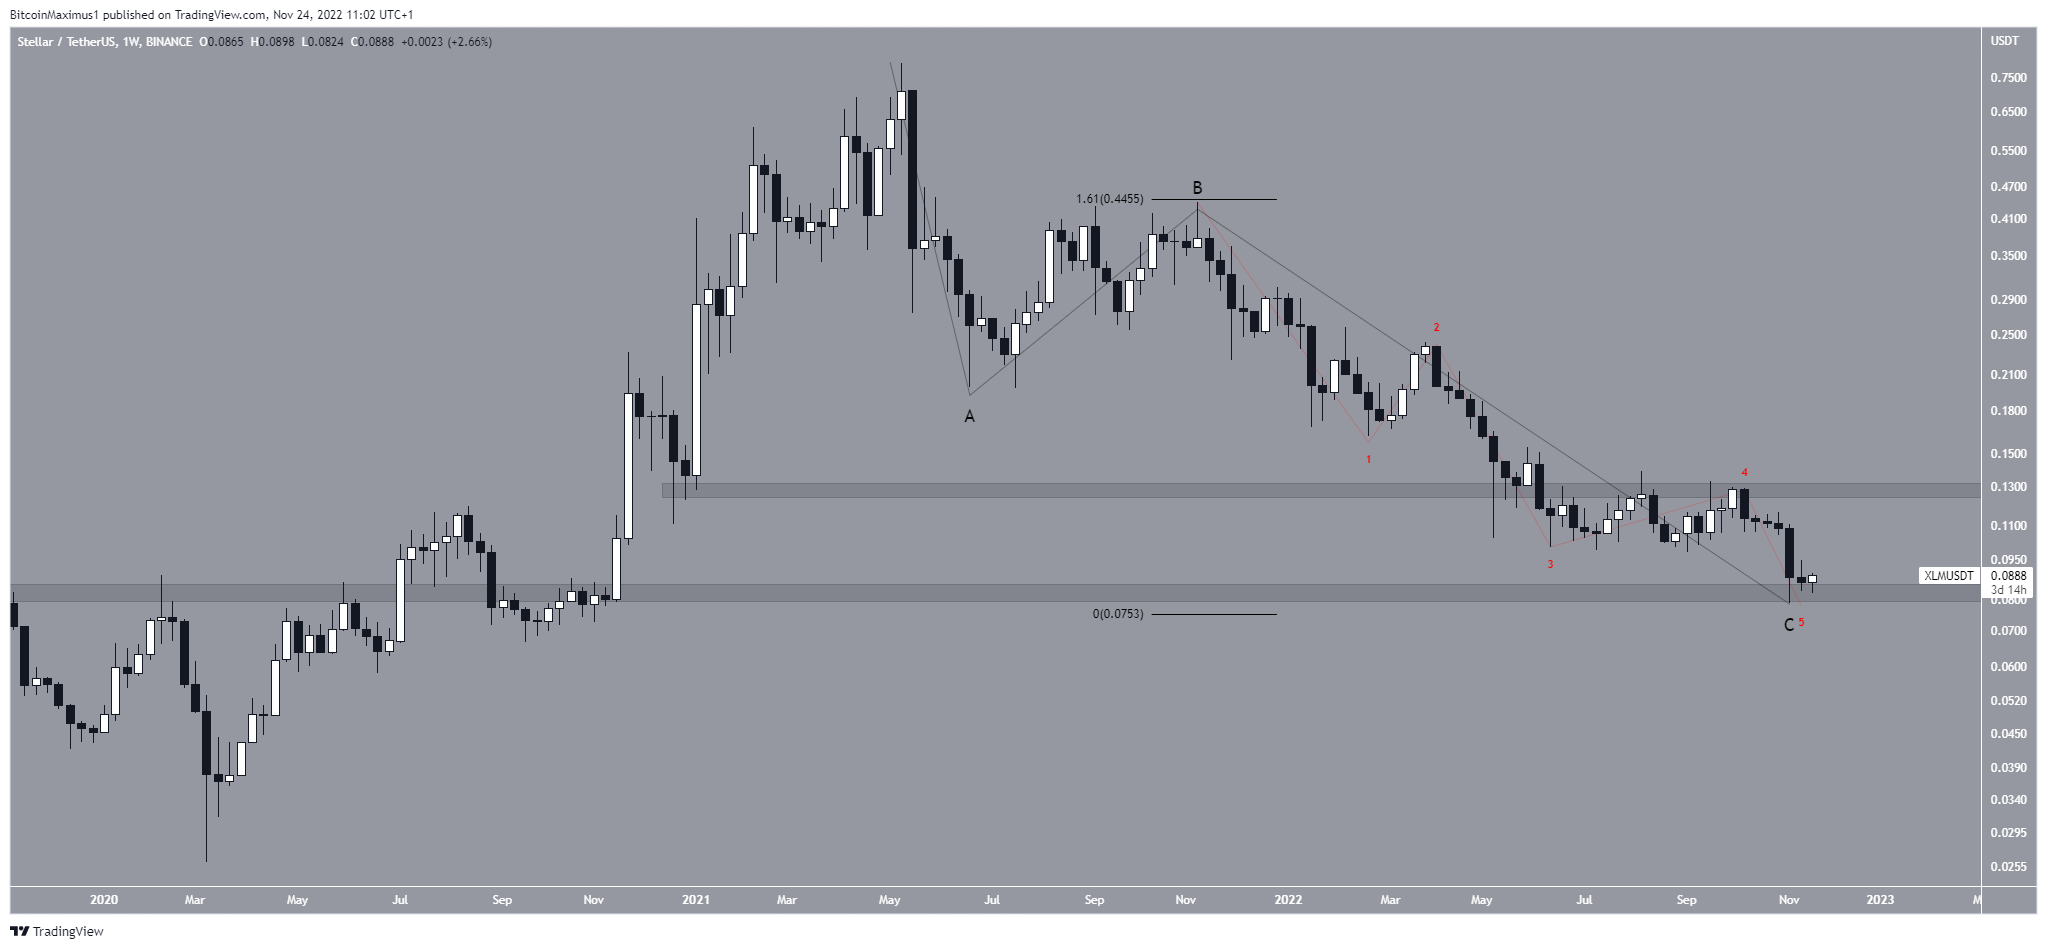
Wave Count Predicts Bottom
The wave count does indicate that the bottom is reached. Since the 2021 high, XLM has possibly completed an A-B-C corrective structure (black). Waves A:C had an exactly 1:1.61 ratio, which is common in such structures.
The sub-wave count is in red, also supporting the possibility of a bottom.
However, the weekly time frame readings are bearish. Moreover, there is crucial resistance at $0.127.
As a result, the direction in which the range is resolved could very well determine the direction of the future trend.
A weekly close above the $0.127 resistance area could lead to a significant rally, taking the XLM price toward its 2021 highs.
Conversely, a breakdown below the $0.085 area could take the XLM price toward its March 2020 lows at $0.03
Disclaimer: BeInCrypto strives to provide accurate and up-to-date news and information, but it will not be responsible for any missing facts or inaccurate information. You comply and understand that you should use any of this information at your own risk. Cryptocurrencies are highly volatile financial assets, so research and make your own financial decisions.