Any dataset of the most recent quarterly returns for crypto assets would undoubtedly reveal a sea of red, the latest chapter in a year of epic declines.
Even among the few cryptocurrencies that gained ground, the news is grim. Their price increases seem more like isolated circumstances rather than the initial hints of a trend upward, as one popular investment tool, Relative Rotation Graphs, indicates. RRGs offer visual representations of asset trends and can help investors foresee shifts in pricing – positive and negative.
Assets with positive returns
Looking at the top 50 assets by market capitalization (Messari) shows the following with positive returns over the most recent 90 days. (The list excludes stablecoins and LUNC.)
-
Dogecoin (DOGE) 13.84%
-
Polygon (MATIC)- 3.93%
-
Litecoin (LTC)- 24.03%
-
The Open Network (TONCOIN) - 20.96%
-
Quant Network (QNT) - 0.80%
-
OKB (OKB) - 16.07%
-
Trust Wallet Token (TWT)- 112.83%
-
Ripple (XRP) - 7.39%
XRP, DOGE, and LTC all act primarily as currencies, but otherwise, each coin on the above list fits within a distinct category, so their gains cannot be attributed to particular events or industry-specific trends.
TWT is the biggest outlier with a 90 day-return of nearly 113%. A closer look shows that much of TWT’s gains occurred over the most recent 11 days. Prices increased from an open of $1.04 on Nov. 10 to as high as $2.74 on Nov. 14. Prices have since retreated to $2.23, and volume has waned substantially as well.
TWT’s 24-hour volume ranks just 29th among assets at $42 million in real volume daily. By comparison, BTC’s daily volume is $3.7 billion. The low volume by comparison is noteworthy, as lower activity can lead to wider price swings.
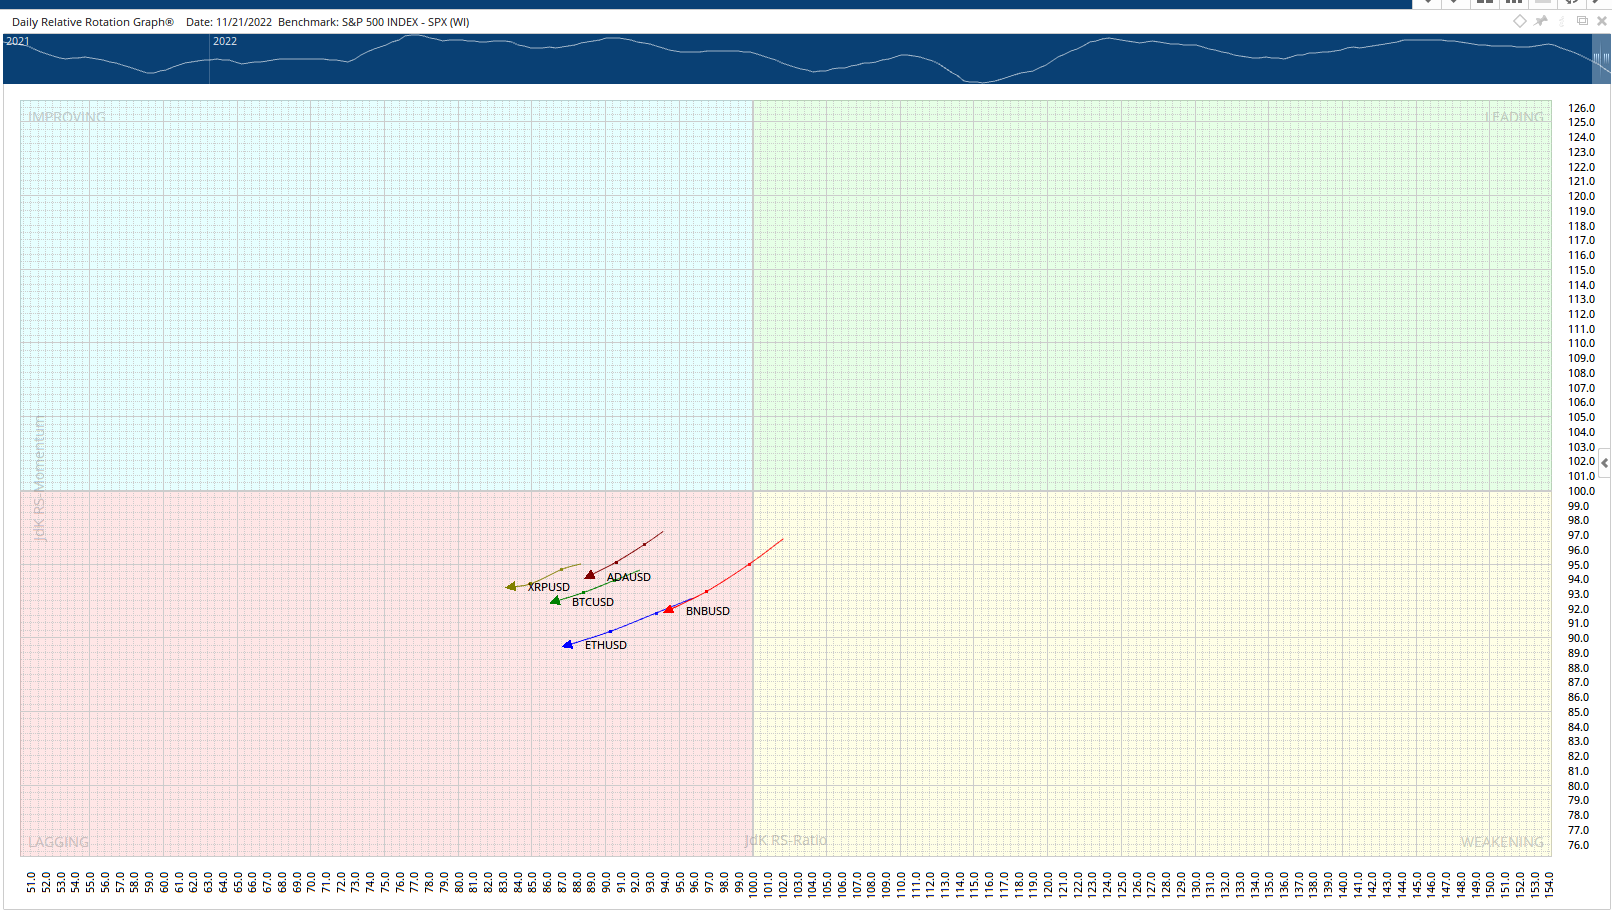
What RRGs are showing
Developed by Julius de Kempanaer, RRGs allow users to view asset performance in four distinct quadrants.
-
Leading - High relative performance and momentum
-
Weakening - Strong relative performance and slowing momentum
-
Lagging - Weak relative performance and momentum
-
Improving - Weak relative performance but increasing momentum
In orderly markets, assets tend to move through each quadrant sequentially.
A strategy often employed in using RRG’s is to identify assets moving into the improving quadrant, with the expectation that in short order it will begin leading the benchmark.
If using RRG’s in isolation, there doesn’t appear to be much opportunity in the above set, as six of the eight assets are either lagging the SPX or weakening versus the SPX. OKB and TWT are currently leading, but TWT’s status is driven by extremely recent price activity.