- Zilliqa coin tries to keep its price above the support line of the descending wedge pattern.
- Stoch RSI is breaking out of the oversold zone on the weekly price scale.
- Speculators witnessed a volatile market as trading volumes surged 116% overnight.
Most altcoins are hovering at their 52-week lows due to the intense selling in the crypto market, in fact, many cryptocurrencies have lost their yearly lows. As bitcoin fell below yearly lows and hit its two-year low in November. Therefore, Zilliqa coin prices struggle at lower levels.
The Zilliqa (ZIL) coin price is performing poorly since its all-time high of $0.2563. The altcoin has lost 91.1% in price over the past two years, which is a massive drop in value. As a result, the collapse of the FTX exchange caused the price of the crypto to hit a 24-month low at the mark of $0.01944.
The Weekly Price Chart of ZIL
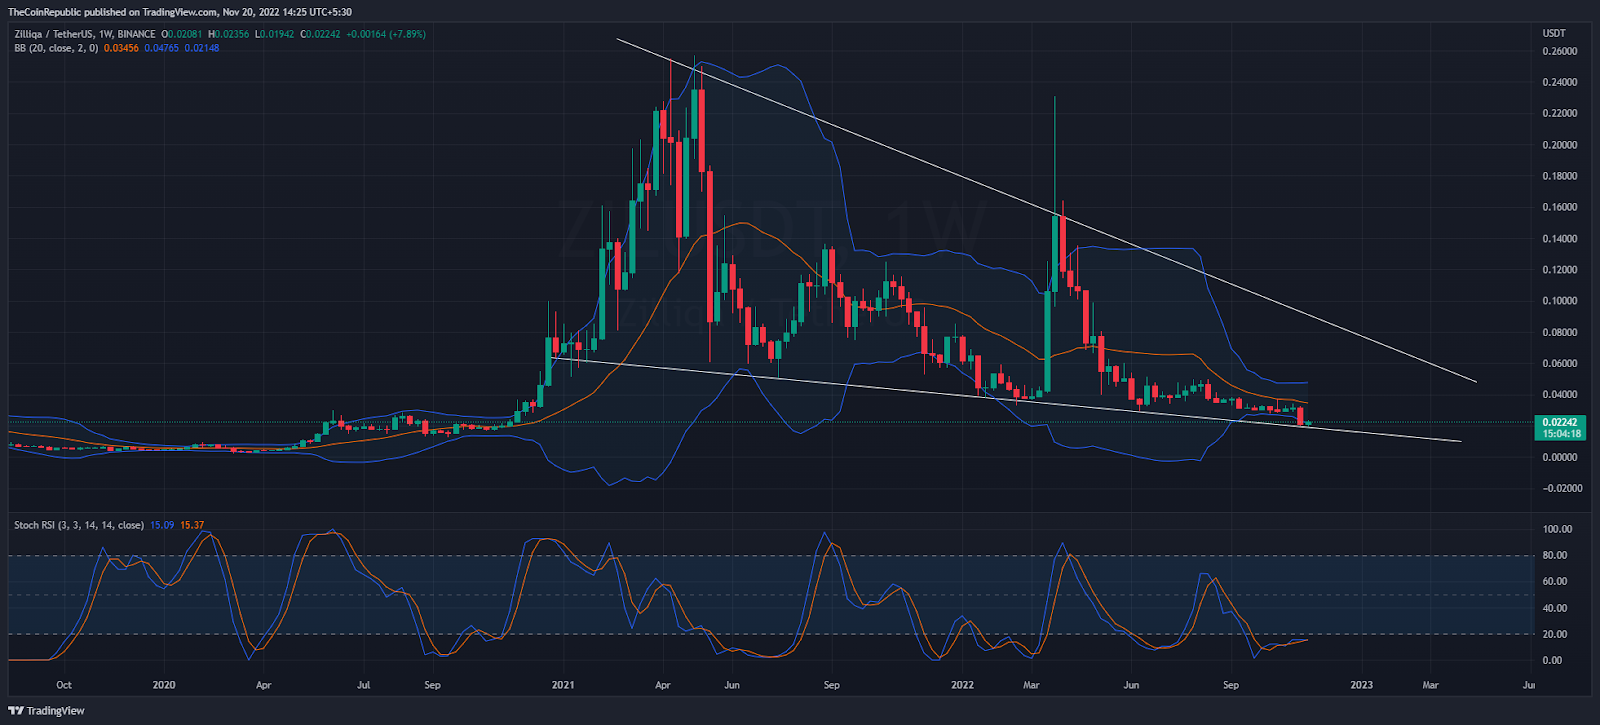
On weekly chart, price action forms the lower-highs and lower-lows formation so far. Thus bears connected all the dots and drew the falling wedge pattern. Later on, ZIL price is hovering just above the support level of fib retracement. Buyers barely attempt to hold this key support level. As well as, the Stoch RSI is exiting from the oversold zone, favor bulls.
At present time, Zilliqa coin price is trading at $0.02257 mark against the USDT pair. Price momentum is looking bullish as price stays higher by 0.67% in intraday trading season. Thus, Speculators witnessed a volatile market as trading volume hiked 116% overnight.
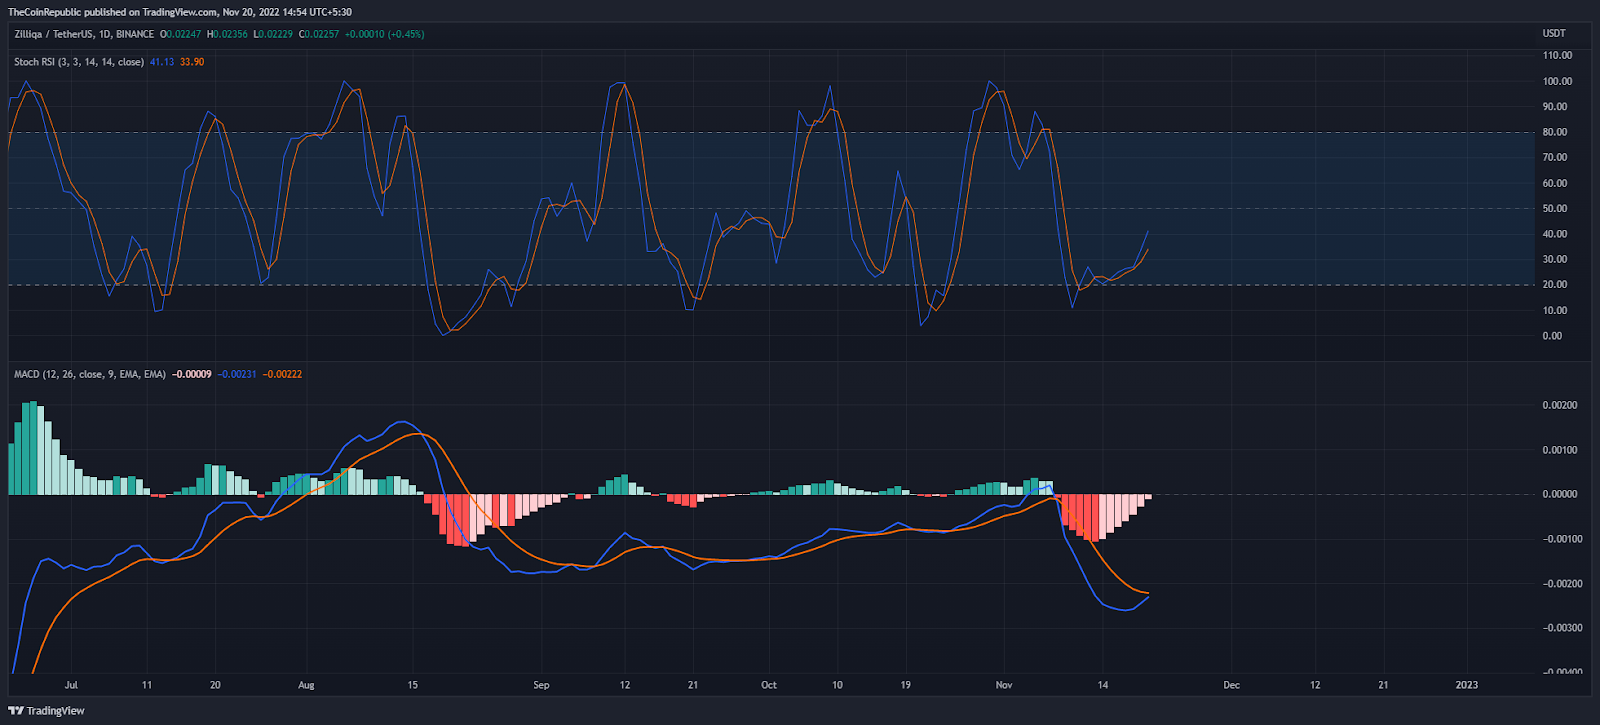
On the daily price scale, the Stoch RSI is extending higher after dipping into the highly oversold zone. Buyers can get influenced by this supportive signal if they are looking to maintain stability in the ZIL price. Similarly, the MACD indicator is still trading in negative territory, but it is showing a bullish crossover.
Conclusion
The Zilliqa coin is looking in the recovery zone after finding support at the support line of a falling wedge pattern. As of now, the bulls must hold a higher-lower trendline on the daily price scale to break out of the bearish pattern.
Support level – $0.020 and $0.015
Resistance level – $0.050 and $0.10
Disclaimer
The views and opinions stated by the author, or any people named in this article, are for informational ideas only, and they do not establish financial, investment, or other advice. Investing in or trading crypto assets comes with a risk of financial loss.