Decentralized trading protocol UniSwap facilitates automated trading of decentralized finance (DeFi) tokens. The automated market maker (AMM), Uniswap, launched in November 2018 but has gained considerable popularity this year with the DeFi phenomenon and associated surge in token trading. Let us look at the technical analysis of UNI.
Past Performance
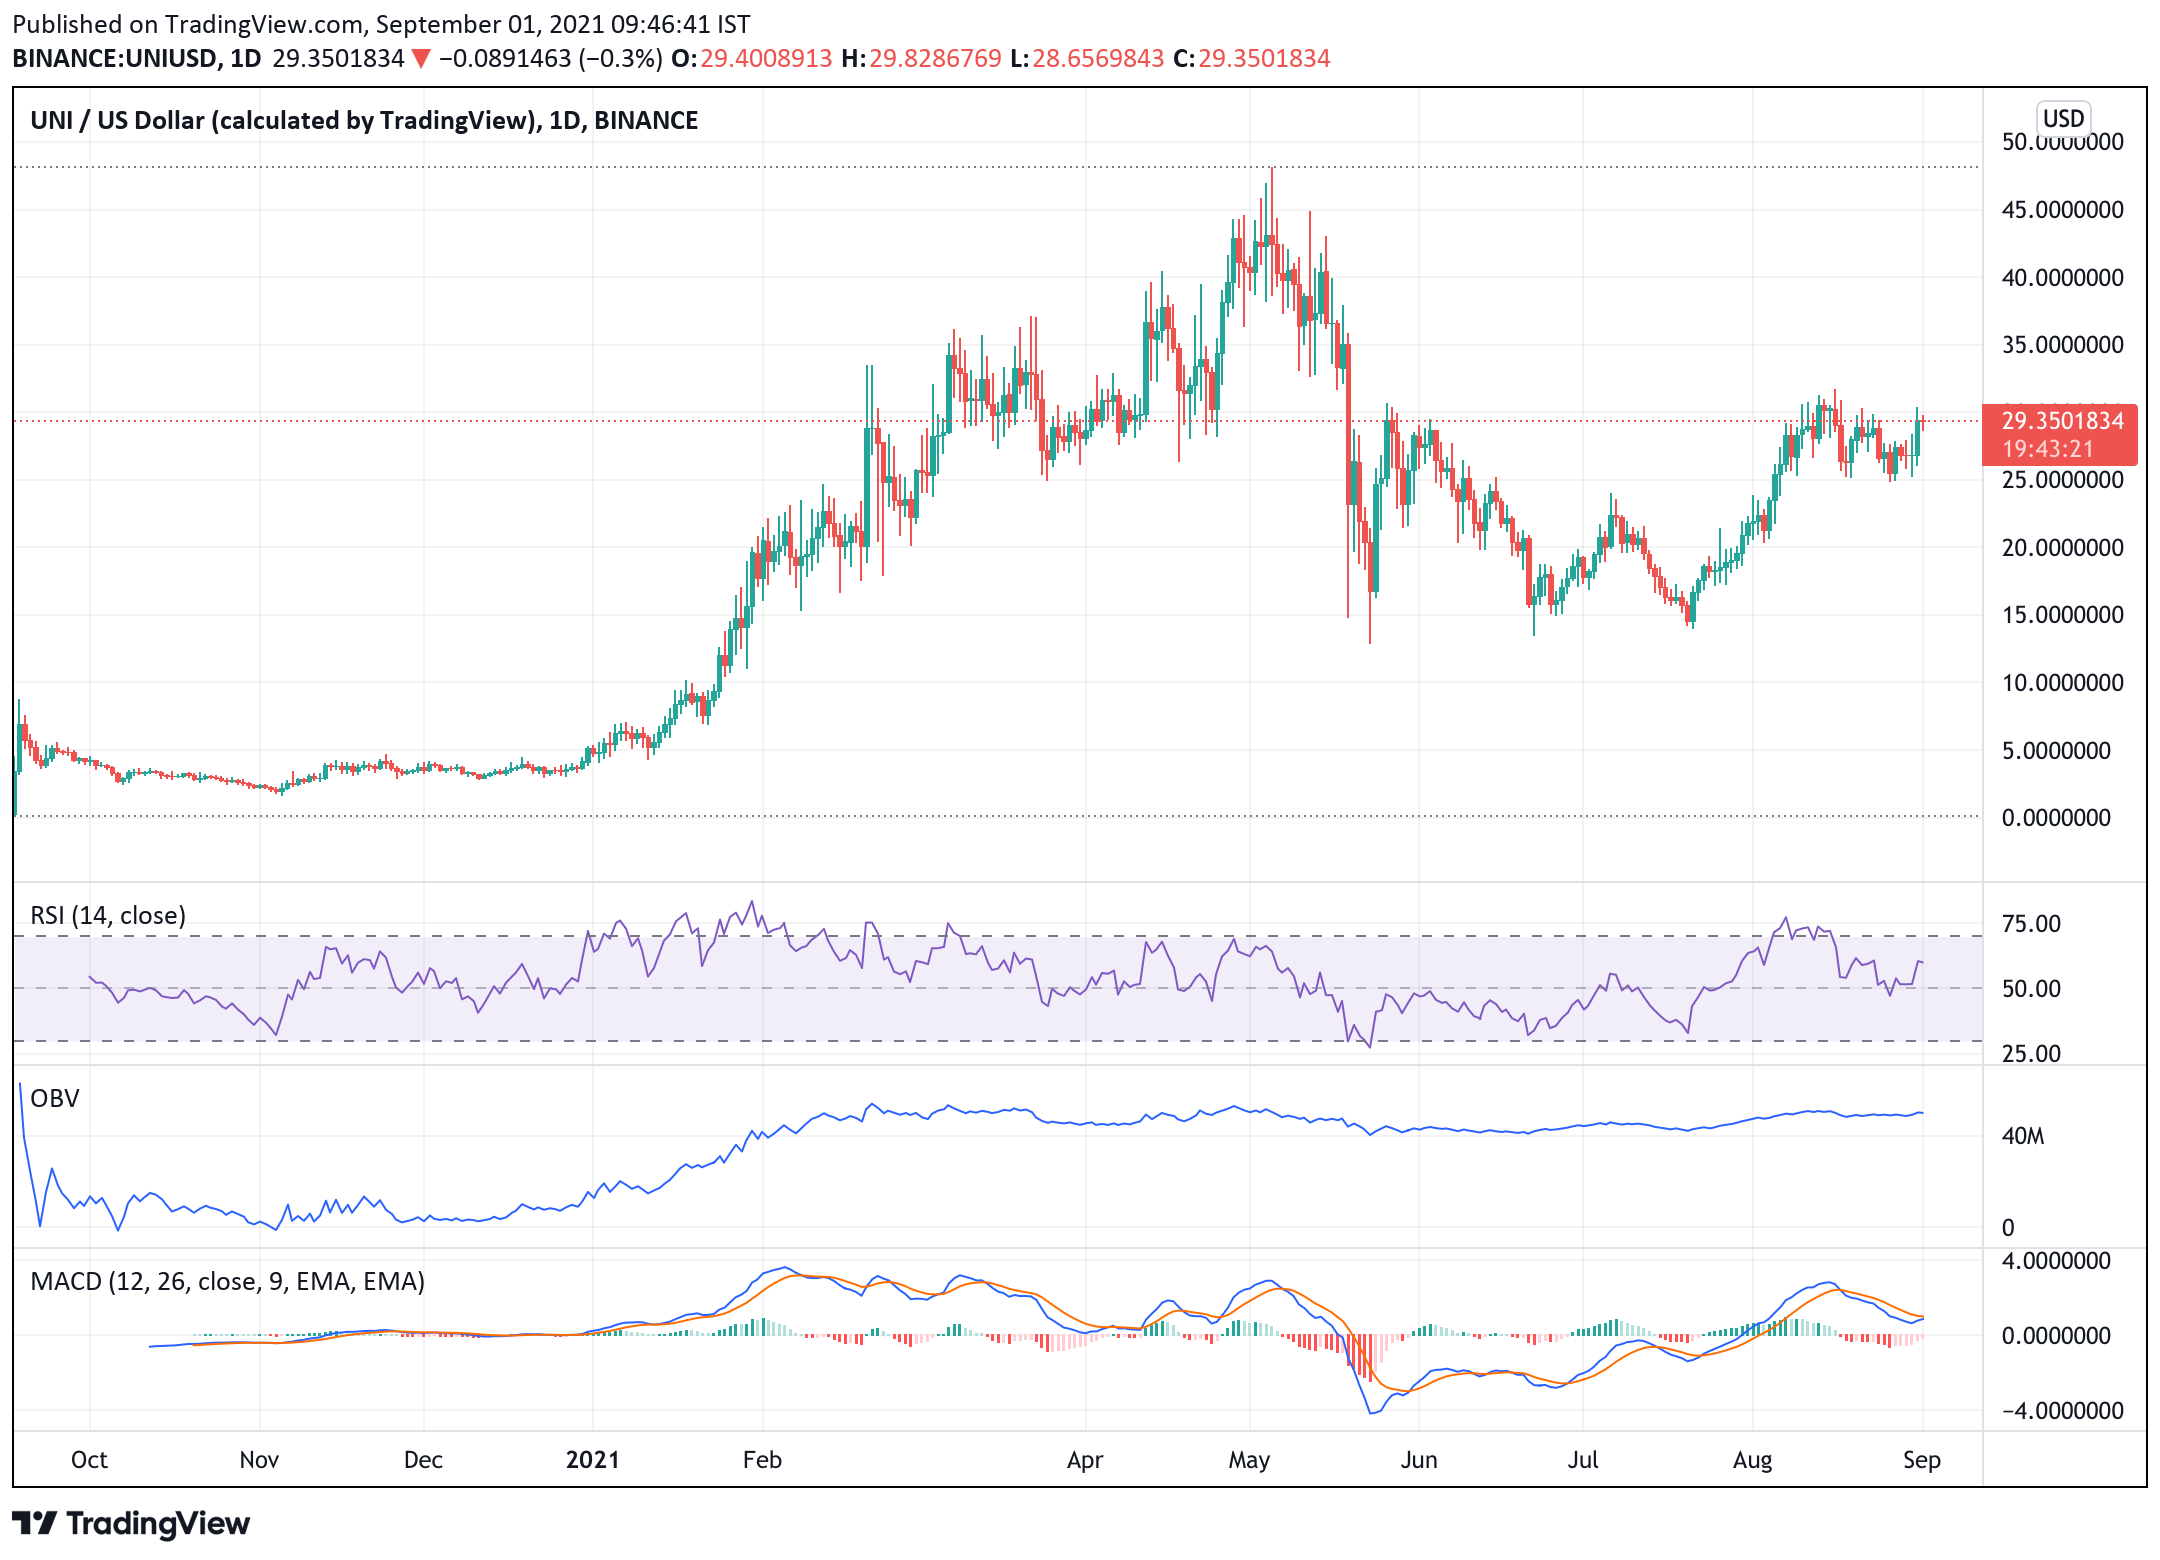
The current price of UNI is $29.46. The price has appreciated by 9.62% in the last 24 hours, resulting in an equivalent appreciation in the market cap of UNI by 9.62%. UNI traded between $26.58-$29.72 in the last 24 hours.
https://www.tradingview.com/x/d0mlYr5g/
UNI Technical Analysis
The RSI is at 60.03%, on the chart we can witness the price touched 60.41% and is making a slight dip, although at this point the market is crucial to watch as the RSI might make another dip suggesting the selling pressures are slowly approaching and if the buying pressures overtakes we might expect a reversal in the trend.
MACD and EMA lines are above the zero range, suggesting a buy. However, there is a bearish crossover on the chart, although the MACD line is moving upwards. We might expect a bullish crossover, but it depends on the buying pressures.
On the daily chart, the OBV can be seen as a straight line suggesting a neutral interest of investors towards UNI.
Day-Ahead and Tomorrow
On the chart, the UNI price is appreciating and has successfully broken its recent high at $29.09. Moving forward, if the buying pressures increase, we might expect the price to move up and test $31.67. Traders can take a long position accordingly.
If the price faces rejection, it will break down, or else, if it resists the rejection, it will move up. However, if the price breaks down, it might immediately find support at $27.53.