LTC technical analysis shows that despite a moderate bullish trend, Litecoin struggles to break above the $75 resistance, while consolidation around $64 indicates the possibility of another bullish breakout. While most of the markets witnessed a drastic drop in their prices, Litecoin (LTC) kept its position intact for the last few weeks. Although LTC witnessed a drop of 2.68% in the last 24 hours, it grew by 6.06% over the last 7 days. For the past two weeks, LTC has been hovering between $46 and $63 unable to break the $75 resistance. Since November 9, LTC is revolving above the support level of $46. Though LTC kept rising over the last week, it still felt moderate selling pressure as prices struggled to stay above $60, indicating active bears at higher levels. The daily chart shows LTC has been trading in a tight range between $56.84 and $58.42. Key Points
- LTC price actions display a moderate bullish trend in the market
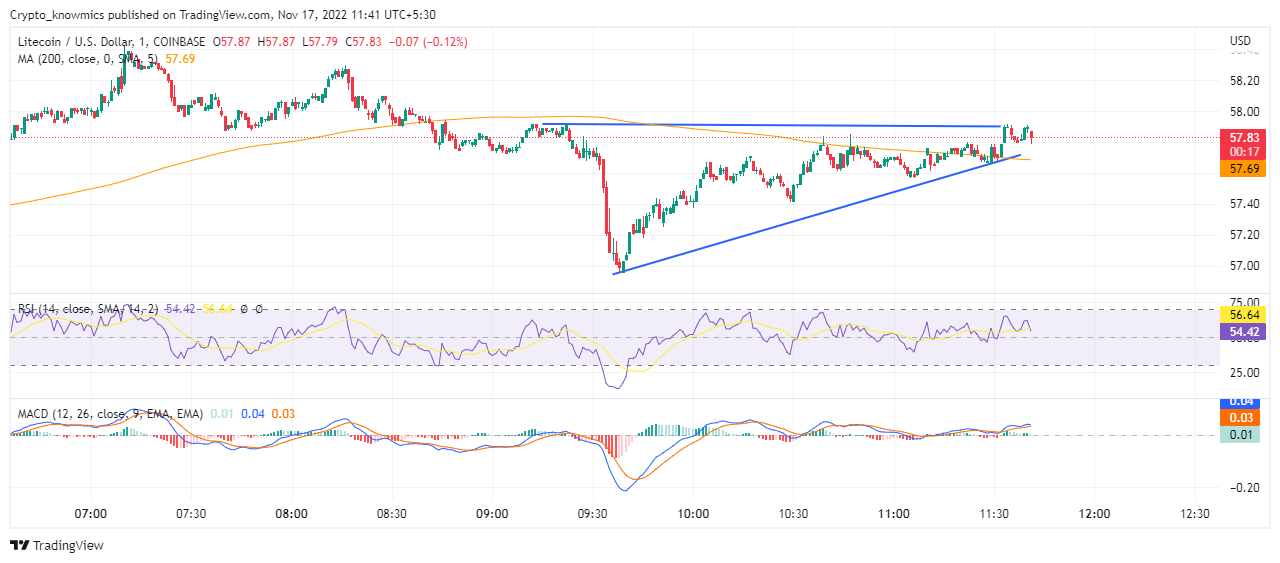
- The trendline making ascending triangles indicates the possibility of a bullish breakout
- The intraday trading volume in LTC is $598.9 billion
 Source: Tradingview
LTC Technical Analysis
The LTC price actions maintain moderate bullishness as prices revolve between $56 and $58. The daily chart shows a balance between demand and supply as LTC did not show aggressive momentum in any direction. Even after consolidating for weeks, the prices struggle to break above the $75 resistance, while the support level remains at $46. The 12.75% rise in the 24-hour trading volume of LTC indicates that traders are actively waiting to book profits when the prices display a bullish breakout or make an entry when there is a strong bullish trend.
Technical Indicators
RSI moving along the midpoint displays a balance between supply and demand. However, the bearish divergence indicates short-term selling pressure. Choppy MACD and signal lines on a bullish histogram still signal a slowdown of bullish momentum. LTC technical indicators show the mid-term bullish trend in the market with a temporary downswing due to selling pressure which may follow a bullish breakout.