Binance Coin has seen another epic surge which totals 11.56% over the past 24 hours, allowing BNB to break above the $30 level and create a fresh all-time high at $32.80. The cryptocurrency has now seen an enormous 262% price explosion over the past 90 trading days, making it the strongest performing cryptocurrency in the top 10.

Source: CoinCheckup
Binance Coin is now currently ranked in 7th position, as it presently holds a $4.51 billion market cap value. The cryptocurrency now only sits $1.16 billion behind 6th position holder Litecoin, which currently holds a $5.67 billion market cap value.
In this article, we will take a look at the resistance along the way for BNB to hit the $40 level before the end of Q2. With over 40 days until Q2 finishes, Binance Coin would need to increase by a total of 45% to reach the $40 target level.
The price increase today came moments after Binance had tweeted a very cryptic tweet with the message of “2.0”:
pic.twitter.com/Uk7RylhVdR
— Binance (@binance) May 21, 2019
Although unconfirmed, some are speculating that this is the full release of their Binance DEX, or a possible hint to upcoming margin trading available on the exchange or the DEX.
Let us take a look at the Binance Coin market against the US Dollar and highlight some potential areas of support and resistance moving forward.
Binance Coin Price Analysis
BNB/USD – MEDIUM TERM – DAILY CHART
What Has Been Going On?
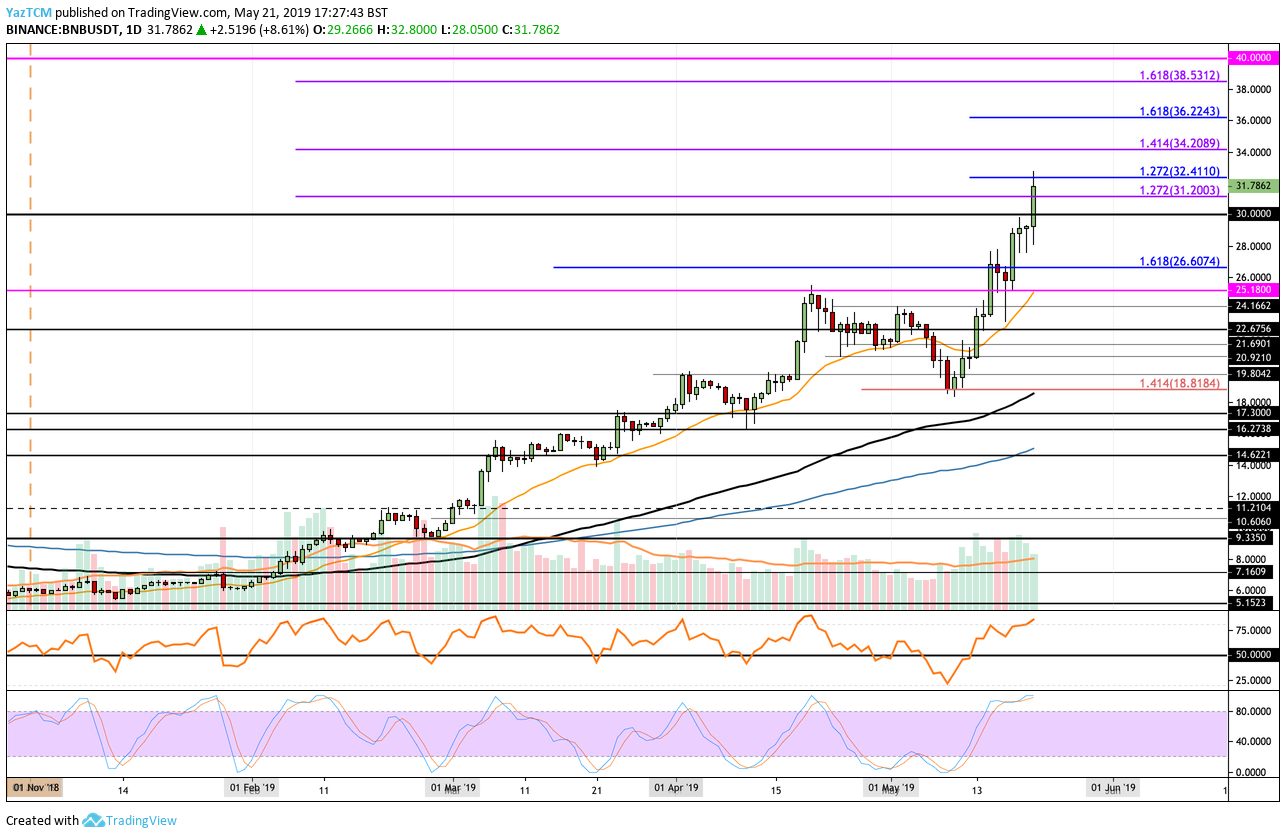
Analyzing the BNB/USD daily chart above, we can see that Binance has had an extraordinary year, having increased by a total of 435% from the opening price for the year. During April 2019, the market continued to rise until meeting resistance at the previous ATH level set at $25.18. The market was unable to overcome this level and proceeded to fall throughout the rest of April.
As May 2019 began to trade, we can see that BNB/USD continued to fall further lower until finding support at a downside 1.414 Fibonacci Extension level priced at $18.81. The market rebounded from this support level and proceeded to rally further higher. Price action managed to break and close above the previous ATH on May 15, 2019, and has continued to climb throughout the month.
The recent price surge seen today has now allowed BNB/USD to break above the $30 level to reach a fresh ATH of $32.80, before falling to where it is currently trading at around $31.78
What Is the Current Short-Term Trend?
The current short-term trend for Binance Coin is obviously extremely bullish. For this bullish trend to be invalidated, we would need to see BNB fall and break beneath the $18.81 level.
Where Is the Resistance On the Way Toward $40?
If the bullish pressure persists and pushes BNB/USD further higher, we can expect immediate resistance above the market to be located at a short-term 1.272 Fibonacci Extension level (drawn in blue), priced at $32.41. This is closely followed up with more resistance at a longer-termed 1.414 Fibonacci Extension level (drawn in purple), priced at $34.20.
If the buyers continue to push price action above the $35 level, we can expect higher resistance to then be located at the short-term 1.618 Fibonacci Extension level (drawn in blue), priced at $36.22. This is then followed up with further resistance at $38, and then at the medium-termed 1.618 Fibonacci Extension level (drawn in purple), priced at $38.53.
If the bulls continue to clear the $38.53 and $39 levels, they will be free to complete the 25% price increase and make an attempt at the $40 target level.
Where Is the Support Beneath the Market?
Alternatively, if the sellers regroup and begin to push the market lower, we can expect immediate strong support beneath the market to be located at the $31.20 and $30 levels. Beneath this, further support below can be expected at $28 and $26.60.
If the selling pressure continues to push Binance Coin beneath its previous ATH price at $25.18, we can expect further support below to be located at the $24.16, $22.67, $21.69, and $20 levels.
What Are the Technical Indicators Reading?
Currently, the technical indicators are suggesting that the bulls are a little overextended, and a retracement should be imminent. The Stochastic RSI is currently poised to produce a bearish crossover signal in overbought territory. Furthermore, the RSI has also reached the overbought territory itself, which signals that the buyers may be running out of steam and may need a short break.
Conclusion
Binance Coin has experienced a wonderful 435% price increase since the yearly open, and has recently been the first coin in the top 50 projects to create a fresh ATH in 2019. Binance Coin certainly has the potential to continue to climb higher and reach the $40 target level before the end of June 2019. Binance Coin will need to increase by 25% and break above strong resistance at $34, $36, and $38 before being free to make an attempt at the target level.
However, it is important to note that the technical indicators show traders to be cautious, as the market may be a little overextended. If this is the case, look for a retracement toward the $30-$28 levels before a rebound higher above $32.80.