- Tron price started a sharp downside correction from the $0.0331 high against the US Dollar.
- TRX price found support near the $0.0245 level and it is currently moving higher towards $0.0300.
- There is an ascending channel forming with support near the $0.0270 level on the 4-hours chart (data feed via Bitfinex).
- The price remains well supported on the downside and it could soon climb above $0.0290 and $0.0300.
TRON price is slowly gaining bullish momentum against the US Dollar, but struggling vs bitcoin. TRX could start a strong upward move if there is an upside break above $0.0300.
Tron Price Analysis
This past week, there was a strong rally in TRON price above the $0.0250 and $0.0280 resistances against the US Dollar. The TRX/USD pair even broke the $0.0300 level and settled above the 55 simple moving average (4-hours). Finally, there was a push above the $0.0320 level and the price traded to a new monthly high at $0.0331. Later, there was a sharp downside correction below the $0.0320 and $0.0300 levels. The price even declined below the $0.0280 level, but it found support near the 55 simple moving average (4-hours).
A swing low was formed at $0.0247 and the price is currently moving higher. It climbed above the $0.0265 level and the 23.6% Fibonacci retracement level of the last decline from the $0.0331 high to $0.0247 low. However, the $0.0285 and $0.0290 levels are currently acting as hurdles. The 50% Fibonacci retracement level of the last decline from the $0.0331 high to $0.0247 low is also acting as a resistance for the bulls. A clear break above the $0.0290 level is likely to open the doors for more gains in the near term.
On the downside, there are many supports near the $0.0270 and $0.0265 levels. There is also an ascending channel forming with support near the $0.0270 level on the 4-hours chart. A downside break below the $0.0265 support level may open the doors for more losses in the near term. The next key supports are near $0.0250 and $0.0245.
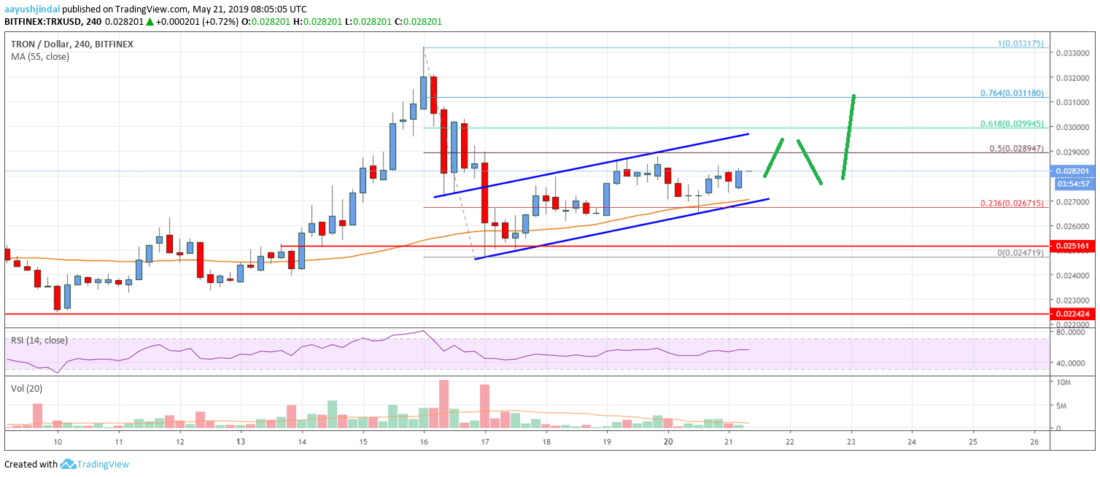
The chart indicates that TRX price is following a decent bullish path above the $0.0265 support. Therefore, there are chances of more gains above the $0.0290 and $0.0300 levels. The next main resistance is near the $0.0330 level, above which the price could trade towards the $0.0360 level.
Technical Indicators
4 hours MACD – The MACD for TRX/USD is slowly gaining momentum in the bullish zone, with positive signs.
4 hours RSI – The RSI for TRX/USD is currently above the 50 level, and it could continue to rise towards the 65 level.
Key Support Levels – $0.0265 and $0.0270.
Key Resistance Levels – $0.0290, $0.0300 and $0.0312.